|
800
|
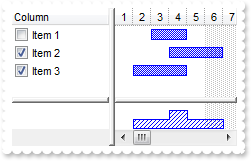
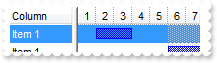
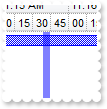
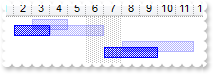
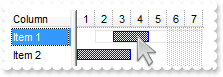
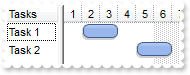
How can I change the color for a particular bar
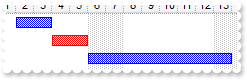
OBJECT g2antt,items;

g2antt =  ObjectByName("AN1") ;
_ObjectSetProperty( _ObjectGetProperty( g2antt , "Chart") , "FirstVisibleDate", "1/1/2001");
_ObjectCallMethod( _ObjectGetProperty( g2antt , "Columns") , "Add", "Column");
items = _ObjectGetProperty( g2antt , "Items");
	_ObjectCallMethod( items , "AddBar", _ObjectCallMethod( items , "AddItem", "Item 1"),"Task","1/2/2001","1/4/2001","B1");
	h = _ObjectCallMethod( items , "AddItem", "Item 2");
	_ObjectCallMethod( items , "AddBar", h,"Task","1/4/2001","1/6/2001","B2");
	_ObjectCallMethod(g2antt, "TemplatePut", "Dim iteObj,h")
	_ObjectCallMethod(g2antt, "TemplatePut", items)
	_ObjectCallMethod(g2antt, "TemplatePut", h)
	_ObjectCallMethod(g2antt, "ExecuteTemplate", "iteObj.ItemBar(h,`B2`,33) = 255");
	_ObjectCallMethod( items , "AddBar", _ObjectCallMethod( items , "AddItem", "Item 3"),"Task","1/6/2001","1/14/2001","B3");
|
|
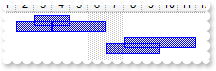
799
|
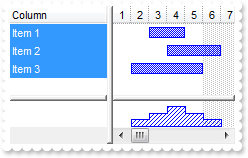
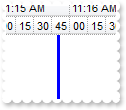
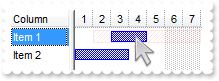
How can I change the color or visual appearance using EBN files for a particular bar
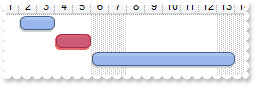
OBJECT bar,chart,g2antt,items;

g2antt =  ObjectByName("AN1") ;
_ObjectCallMethod( _ObjectGetProperty( g2antt , "VisualAppearance") , "Add", 1,"gBFLBCJwBAEHhEJAEGg4BGoCg6AADACAxRDAMgBQKAAzQFAYZhhBaERiGEaIJhUAIIRZGMQxXAcMQvDSKQJhGLhQiSJoJDSBEgSXDIZQ5D6OZYACDJQACJYJTbAYzyP" +
	"JkPRAA6EZCmGAwCglf5HABRb7xNLkbQ8GySKJnWCQJhoD5BSLCNRUTRFFQtGgZBpEWwLCjQNQwWLKFoTJIEPSBDKqYDoKYqTgOOZOThHQz3HakQRdAa/ZpnaKpUo2d47" +
	"XjMWBwGA0EzeAAGaxoShqdoiFaGU7UOJVJBOGwHK6BchoMAKbp6XoVWRaOAWLZWVABM7XLZxbLccyGfZ1XhdV5UbqUMznR7PNrjLKIJpCOJbbyAFwgBaeQABYLhK7iHR" +
	"mi8XYwjMWpjFWOx1GIB5LmgdB4HCEBECSIBpDGHQOicIwokYPImikEIJj6eJIloEgogSc40FGcJEFiYZIG2VIoAURw1g2QxyAQNwNAMPJOgIYI4CoDIBmAeAKBIUpQDU" +
	"KJYDoTpIB4vxgmgdgNgeYZDDoFw7CEJhQn+BohmKfImCWSZRlgYwikYMQ0gwF4DniTA/gwBJYjQYwsgoIg6AyCRQDiIJODAZBImoOguAmMZ4lQLIJjOMI3CYZJpEIT4K" +
	"iKSI6DqD5ZGAAgHC2DAjBYR4SGUGYGE+GIlCmFhRhIB5iFAbwWsiJgMhoCoxngV4ZCcSYOHaGYnHmIg8COJpoCoOISmSWZeHWHgoEkRoAg4EIYB4NogmiSgKg6GRjGoJ" +
	"gFh+ZJKDaBYjmgaQygiBRUHmbhoDsTAyiqIIoioGoOw8aoKhKKoemeOIaAeF5HmqHoqiyKxKgYaN/locgBiuZRojoVIok8cwsjaMBLGqDoAhGIpoEYWYEmAIxUkQLZmg" +
	"iYg2g2I4JiCQwuAqWIOIkEAQICA==");
chart = _ObjectGetProperty( g2antt , "Chart");
	_ObjectSetProperty( chart , "FirstVisibleDate", "1/1/2001");
	bar = _ObjectCallMethod(g2antt, "ExecuteTemplate", "chaObj.Bars.Item(`Task`)");
		_ObjectSetProperty( bar , "Color", 16777216);
		_ObjectSetProperty( bar , "Height", 16);
_ObjectCallMethod( _ObjectGetProperty( g2antt , "Columns") , "Add", "Column");
items = _ObjectGetProperty( g2antt , "Items");
	_ObjectCallMethod( items , "AddBar", _ObjectCallMethod( items , "AddItem", "Item 1"),"Task","1/2/2001","1/4/2001","B1");
	h = _ObjectCallMethod( items , "AddItem", "Item 2");
	_ObjectCallMethod( items , "AddBar", h,"Task","1/4/2001","1/6/2001","B2");
	_ObjectCallMethod(g2antt, "TemplatePut", "Dim iteObj,h")
	_ObjectCallMethod(g2antt, "TemplatePut", items)
	_ObjectCallMethod(g2antt, "TemplatePut", h)
	_ObjectCallMethod(g2antt, "ExecuteTemplate", "iteObj.ItemBar(h,`B2`,33) = 255");
	_ObjectCallMethod( items , "AddBar", _ObjectCallMethod( items , "AddItem", "Item 3"),"Task","1/6/2001","1/14/2001","B3");
|
|
798
|
How can I resize programmatically a bar
OBJECT g2antt,items;

g2antt =  ObjectByName("AN1") ;
_ObjectSetProperty( _ObjectGetProperty( g2antt , "Chart") , "FirstVisibleDate", "1/1/2001");
_ObjectCallMethod( _ObjectGetProperty( g2antt , "Columns") , "Add", "Column");
items = _ObjectGetProperty( g2antt , "Items");
	h = _ObjectCallMethod( items , "AddItem", "Item 1");
	_ObjectCallMethod( items , "AddBar", h,"Task","1/4/2001","1/6/2001","B2");
	_ObjectCallMethod(g2antt, "TemplatePut", "Dim iteObj,h")
	_ObjectCallMethod(g2antt, "TemplatePut", items)
	_ObjectCallMethod(g2antt, "TemplatePut", h)
	_ObjectCallMethod(g2antt, "ExecuteTemplate", "iteObj.ItemBar(h,`B2`,513) = 1");
|
|
797
|
How can I move programmatically a bar
OBJECT g2antt,items;

g2antt =  ObjectByName("AN1") ;
_ObjectSetProperty( _ObjectGetProperty( g2antt , "Chart") , "FirstVisibleDate", "1/1/2001");
_ObjectCallMethod( _ObjectGetProperty( g2antt , "Columns") , "Add", "Column");
items = _ObjectGetProperty( g2antt , "Items");
	h = _ObjectCallMethod( items , "AddItem", "Item 1");
	_ObjectCallMethod( items , "AddBar", h,"Task","1/4/2001","1/6/2001","B2");
	_ObjectCallMethod(g2antt, "TemplatePut", "Dim iteObj,h")
	_ObjectCallMethod(g2antt, "TemplatePut", items)
	_ObjectCallMethod(g2antt, "TemplatePut", h)
	_ObjectCallMethod(g2antt, "ExecuteTemplate", "iteObj.ItemBar(h,`B2`,514) = -2");
|
|
796
|
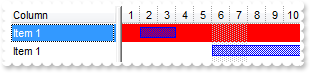
How can I select displaying the histogram for an item and all its child items
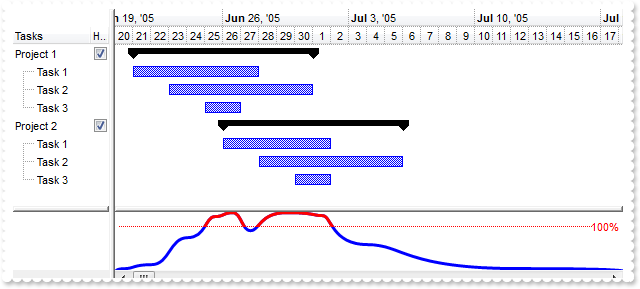
OBJECT bar,chart,column,g2antt,items;

g2antt =  ObjectByName("AN1") ;
_ObjectCallMethod( g2antt , "BeginUpdate");
_ObjectSetProperty( g2antt , "MarkSearchColumn", 0);
_ObjectSetProperty( g2antt , "ShowFocusRect", 0);
_ObjectCallMethod( _ObjectGetProperty( g2antt , "Columns") , "Add", "Tasks");
column = _ObjectCallMethod( _ObjectGetProperty( g2antt , "Columns") , "Add", "Hist");
	_ObjectCallMethod(g2antt, "TemplatePut", "Dim colObj")
	_ObjectCallMethod(g2antt, "TemplatePut", column)
	_ObjectCallMethod(g2antt, "ExecuteTemplate", "colObj.Def(0) = True");
	_ObjectSetProperty( column , "PartialCheck", -1);
	_ObjectSetProperty( column , "AllowSizing", 0);
	_ObjectSetProperty( column , "Width", 18);
chart = _ObjectGetProperty( g2antt , "Chart");
	_ObjectSetProperty( chart , "LevelCount", 2);
	_ObjectSetProperty( chart , "NonworkingDays", 0);
	_ObjectCallMethod(g2antt, "TemplatePut", "Dim chaObj")
	_ObjectCallMethod(g2antt, "TemplatePut", chart)
	_ObjectCallMethod(g2antt, "ExecuteTemplate", "chaObj.PaneWidth(0) = 96");
	_ObjectSetProperty( chart , "FirstVisibleDate", "6/20/2005");
	_ObjectSetProperty( chart , "HistogramVisible", -1);
	_ObjectSetProperty( chart , "HistogramView", 67348);
	_ObjectSetProperty( chart , "HistogramHeight", 64);
	bar = _ObjectCallMethod(g2antt, "ExecuteTemplate", "chaObj.Bars.Item(`Task`)");
		_ObjectSetProperty( bar , "HistogramCriticalColor", 255);
		_ObjectSetProperty( bar , "HistogramPattern", 512);
		_ObjectSetProperty( bar , "HistogramType", 1);
items = _ObjectGetProperty( g2antt , "Items");
	h = _ObjectCallMethod( items , "AddItem", "Project 1");
	_ObjectCallMethod( items , "AddBar", h,"Summary","6/21/2005","7/1/2005");
	h1 = _ObjectCallMethod( items , "InsertItem", h,"","Task 1");
	_ObjectCallMethod( items , "AddBar", h1,"Task","6/21/2005","6/28/2005");
	_ObjectCallMethod(g2antt, "TemplatePut", "Dim iteObj,h1")
	_ObjectCallMethod(g2antt, "TemplatePut", items)
	_ObjectCallMethod(g2antt, "TemplatePut", h1)
	_ObjectCallMethod(g2antt, "ExecuteTemplate", "iteObj.CellMerge(h1,0) = 1");
	_ObjectCallMethod( items , "DefineSummaryBars", h,"",h1,"");
	h1 = _ObjectCallMethod( items , "InsertItem", h,"","Task 2");
	_ObjectCallMethod( items , "AddBar", h1,"Task","6/23/2005","7/1/2005","E");
	_ObjectCallMethod(g2antt, "ExecuteTemplate", "iteObj.CellMerge(h1,0) = 1");
	_ObjectCallMethod( items , "DefineSummaryBars", h,"",h1,"E");
	_ObjectCallMethod(g2antt, "ExecuteTemplate", "iteObj.ItemBar(h1,`E`,21) = 5");
	h1 = _ObjectCallMethod( items , "InsertItem", h,"","Task 3");
	_ObjectCallMethod( items , "AddBar", h1,"Task","6/25/2005","6/27/2005","E");
	_ObjectCallMethod(g2antt, "ExecuteTemplate", "iteObj.CellMerge(h1,0) = 1");
	_ObjectCallMethod( items , "DefineSummaryBars", h,"",h1,"E");
	_ObjectCallMethod(g2antt, "TemplatePut", "Dim iteObj,h")
	_ObjectCallMethod(g2antt, "TemplatePut", items)
	_ObjectCallMethod(g2antt, "TemplatePut", h)
	_ObjectCallMethod(g2antt, "ExecuteTemplate", "iteObj.ExpandItem(h) = True");
	_ObjectCallMethod(g2antt, "ExecuteTemplate", "iteObj.CellState(h,1) = 1");
	h = _ObjectCallMethod( items , "AddItem", "Project 2");
	_ObjectCallMethod( items , "AddBar", h,"Summary","6/26/2005","7/6/2005");
	h1 = _ObjectCallMethod( items , "InsertItem", h,"","Task 1");
	_ObjectCallMethod( items , "AddBar", h1,"Task","6/26/2005","7/2/2005");
	_ObjectCallMethod(g2antt, "TemplatePut", "Dim iteObj,h1")
	_ObjectCallMethod(g2antt, "TemplatePut", items)
	_ObjectCallMethod(g2antt, "TemplatePut", h1)
	_ObjectCallMethod(g2antt, "ExecuteTemplate", "iteObj.CellMerge(h1,0) = 1");
	_ObjectCallMethod( items , "DefineSummaryBars", h,"",h1,"");
	h1 = _ObjectCallMethod( items , "InsertItem", h,"","Task 2");
	_ObjectCallMethod( items , "AddBar", h1,"Task","6/28/2005","7/6/2005","E");
	_ObjectCallMethod(g2antt, "ExecuteTemplate", "iteObj.CellMerge(h1,0) = 1");
	_ObjectCallMethod( items , "DefineSummaryBars", h,"",h1,"E");
	_ObjectCallMethod(g2antt, "ExecuteTemplate", "iteObj.ItemBar(h1,`E`,21) = 5");
	h1 = _ObjectCallMethod( items , "InsertItem", h,"","Task 3");
	_ObjectCallMethod( items , "AddBar", h1,"Task","6/30/2005","7/2/2005","E");
	_ObjectCallMethod(g2antt, "ExecuteTemplate", "iteObj.CellMerge(h1,0) = 1");
	_ObjectCallMethod( items , "DefineSummaryBars", h,"",h1,"E");
	_ObjectCallMethod(g2antt, "TemplatePut", "Dim iteObj,h")
	_ObjectCallMethod(g2antt, "TemplatePut", items)
	_ObjectCallMethod(g2antt, "TemplatePut", h)
	_ObjectCallMethod(g2antt, "ExecuteTemplate", "iteObj.ExpandItem(h) = True");
	_ObjectCallMethod(g2antt, "ExecuteTemplate", "iteObj.CellState(h,1) = 1");
_ObjectCallMethod( g2antt , "EndUpdate");
|
|
795
|
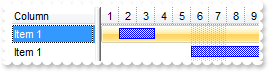
How can I select or specify the items being included in the histogram, (using a different column )
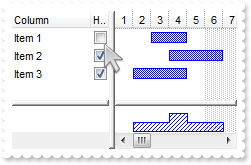
OBJECT chart,column,g2antt,items;

g2antt =  ObjectByName("AN1") ;
_ObjectCallMethod( g2antt , "BeginUpdate");
_ObjectSetProperty( g2antt , "MarkSearchColumn", 0);
chart = _ObjectGetProperty( g2antt , "Chart");
	_ObjectSetProperty( chart , "FirstVisibleDate", "1/1/2001");
	_ObjectSetProperty( chart , "HistogramVisible", -1);
	_ObjectSetProperty( chart , "HistogramView", 65540);
	_ObjectSetProperty( chart , "HistogramHeight", 32);
	_ObjectCallMethod(g2antt, "TemplatePut", "Dim chaObj")
	_ObjectCallMethod(g2antt, "TemplatePut", chart)
	_ObjectCallMethod(g2antt, "ExecuteTemplate", "chaObj.Bars.Item(`Task`).HistogramPattern = 6");
_ObjectCallMethod( _ObjectGetProperty( g2antt , "Columns") , "Add", "Column");
column = _ObjectCallMethod( _ObjectGetProperty( g2antt , "Columns") , "Add", "Histogram");
	_ObjectCallMethod(g2antt, "TemplatePut", "Dim colObj")
	_ObjectCallMethod(g2antt, "TemplatePut", column)
	_ObjectCallMethod(g2antt, "ExecuteTemplate", "colObj.Def(0) = True");
	_ObjectSetProperty( column , "AllowSizing", 0);
	_ObjectSetProperty( column , "Width", 18);
items = _ObjectGetProperty( g2antt , "Items");
	_ObjectCallMethod( items , "AddBar", _ObjectCallMethod( items , "AddItem", "Item 1"),"Task","1/3/2001","1/5/2001");
	h = _ObjectCallMethod( items , "AddItem", "Item 2");
	_ObjectCallMethod( items , "AddBar", h,"Task","1/4/2001","1/7/2001");
	_ObjectCallMethod(g2antt, "TemplatePut", "Dim iteObj,h")
	_ObjectCallMethod(g2antt, "TemplatePut", items)
	_ObjectCallMethod(g2antt, "TemplatePut", h)
	_ObjectCallMethod(g2antt, "ExecuteTemplate", "iteObj.CellState(h,1) = 1");
	h = _ObjectCallMethod( items , "AddItem", "Item 3");
	_ObjectCallMethod( items , "AddBar", h,"Task","1/2/2001","1/5/2001");
	_ObjectCallMethod(g2antt, "ExecuteTemplate", "iteObj.CellState(h,1) = 1");
_ObjectCallMethod( g2antt , "EndUpdate");
|
|
794
|
How can I select or specify the items being included in the histogram
OBJECT chart,g2antt,items;

g2antt =  ObjectByName("AN1") ;
_ObjectCallMethod( g2antt , "BeginUpdate");
chart = _ObjectGetProperty( g2antt , "Chart");
	_ObjectSetProperty( chart , "FirstVisibleDate", "1/1/2001");
	_ObjectSetProperty( chart , "HistogramVisible", -1);
	_ObjectSetProperty( chart , "HistogramView", 4);
	_ObjectSetProperty( chart , "HistogramHeight", 32);
	_ObjectCallMethod(g2antt, "TemplatePut", "Dim chaObj")
	_ObjectCallMethod(g2antt, "TemplatePut", chart)
	_ObjectCallMethod(g2antt, "ExecuteTemplate", "chaObj.Bars.Item(`Task`).HistogramPattern = 6");
_ObjectCallMethod(g2antt, "ExecuteTemplate", "Columns.Add(`Column`).Def(0) = True");
items = _ObjectGetProperty( g2antt , "Items");
	_ObjectCallMethod( items , "AddBar", _ObjectCallMethod( items , "AddItem", "Item 1"),"Task","1/3/2001","1/5/2001");
	h = _ObjectCallMethod( items , "AddItem", "Item 2");
	_ObjectCallMethod( items , "AddBar", h,"Task","1/4/2001","1/7/2001");
	_ObjectCallMethod(g2antt, "TemplatePut", "Dim iteObj,h")
	_ObjectCallMethod(g2antt, "TemplatePut", items)
	_ObjectCallMethod(g2antt, "TemplatePut", h)
	_ObjectCallMethod(g2antt, "ExecuteTemplate", "iteObj.CellState(h,0) = 1");
	h = _ObjectCallMethod( items , "AddItem", "Item 3");
	_ObjectCallMethod( items , "AddBar", h,"Task","1/2/2001","1/5/2001");
	_ObjectCallMethod(g2antt, "ExecuteTemplate", "iteObj.CellState(h,0) = 1");
_ObjectCallMethod( g2antt , "EndUpdate");
|
|
793
|
Is there any option to display the histogram for selected items only
OBJECT chart,g2antt,items;

g2antt =  ObjectByName("AN1") ;
_ObjectCallMethod( g2antt , "BeginUpdate");
_ObjectSetProperty( g2antt , "SingleSel", 0);
chart = _ObjectGetProperty( g2antt , "Chart");
	_ObjectSetProperty( chart , "FirstVisibleDate", "1/1/2001");
	_ObjectSetProperty( chart , "HistogramVisible", -1);
	_ObjectSetProperty( chart , "HistogramView", 2);
	_ObjectSetProperty( chart , "HistogramHeight", 32);
	_ObjectCallMethod(g2antt, "TemplatePut", "Dim chaObj")
	_ObjectCallMethod(g2antt, "TemplatePut", chart)
	_ObjectCallMethod(g2antt, "ExecuteTemplate", "chaObj.Bars.Item(`Task`).HistogramPattern = 6");
_ObjectCallMethod( _ObjectGetProperty( g2antt , "Columns") , "Add", "Column");
items = _ObjectGetProperty( g2antt , "Items");
	_ObjectCallMethod( items , "AddBar", _ObjectCallMethod( items , "AddItem", "Item 1"),"Task","1/3/2001","1/5/2001");
	_ObjectCallMethod( items , "AddBar", _ObjectCallMethod( items , "AddItem", "Item 2"),"Task","1/4/2001","1/7/2001");
	_ObjectCallMethod( items , "AddBar", _ObjectCallMethod( items , "AddItem", "Item 3"),"Task","1/2/2001","1/6/2001");
	_ObjectCallMethod( items , "SelectAll");
_ObjectCallMethod( g2antt , "EndUpdate");
|
|
792
|
Is it possible to add bars to a summary bar so, they get resized or moved as soon as a bar is changed
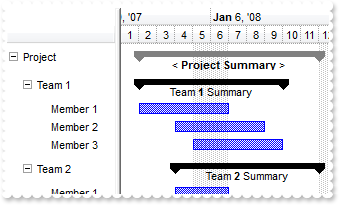
OBJECT chart,g2antt,items;

g2antt =  ObjectByName("AN1") ;
_ObjectCallMethod( g2antt , "BeginUpdate");
_ObjectSetProperty( g2antt , "BackColor", 16777215);
_ObjectSetProperty( g2antt , "ShowFocusRect", 0);
_ObjectSetProperty( g2antt , "HasLines", 0);
_ObjectSetProperty( g2antt , "LinesAtRoot", -1);
_ObjectSetProperty( g2antt , "HasLines", 0);
_ObjectSetProperty( g2antt , "Indent", 14);
_ObjectSetProperty( g2antt , "FullRowSelect", 0);
_ObjectSetProperty( g2antt , "ScrollBySingleLine", -1);
chart = _ObjectGetProperty( g2antt , "Chart");
	_ObjectSetProperty( chart , "BackColor", 16777215);
	_ObjectSetProperty( chart , "SelBackColor", 16119285);
	_ObjectSetProperty( chart , "AllowCreateBar", 0);
	_ObjectSetProperty( chart , "AllowLinkBars", 0);
	_ObjectSetProperty( chart , "FirstVisibleDate", "1/1/2008");
	_ObjectSetProperty( chart , "LevelCount", 2);
	_ObjectCallMethod(g2antt, "TemplatePut", "Dim chaObj")
	_ObjectCallMethod(g2antt, "TemplatePut", chart)
	_ObjectCallMethod(g2antt, "ExecuteTemplate", "chaObj.PaneWidth(0) = 98");
_ObjectCallMethod( _ObjectGetProperty( g2antt , "Columns") , "Add", "");
items = _ObjectGetProperty( g2antt , "Items");
	hProject = _ObjectCallMethod( items , "AddItem", "Project");
	_ObjectCallMethod(g2antt, "TemplatePut", "Dim iteObj,hProject")
	_ObjectCallMethod(g2antt, "TemplatePut", items)
	_ObjectCallMethod(g2antt, "TemplatePut", hProject)
	_ObjectCallMethod(g2antt, "ExecuteTemplate", "iteObj.ItemHeight(hProject) = 26");
	_ObjectCallMethod( items , "AddBar", hProject,"Project Summary","1/2/2008","1/5/2008");
	_ObjectCallMethod(g2antt, "ExecuteTemplate", "iteObj.ItemBar(hProject,``,3) = `<br>< <b>Project Summary</b> >`");
	hR1 = _ObjectCallMethod( items , "InsertItem", hProject,"","Team 1");
	_ObjectCallMethod(g2antt, "TemplatePut", "Dim iteObj,hR1")
	_ObjectCallMethod(g2antt, "TemplatePut", items)
	_ObjectCallMethod(g2antt, "TemplatePut", hR1)
	_ObjectCallMethod(g2antt, "ExecuteTemplate", "iteObj.ItemHeight(hR1) = 30");
	_ObjectCallMethod( items , "AddBar", hR1,"Summary","1/2/2008","1/8/2008");
	_ObjectCallMethod(g2antt, "ExecuteTemplate", "iteObj.ItemBar(hR1,``,3) = `<br> Team <b>1</b> Summary `");
	h1 = _ObjectCallMethod( items , "InsertItem", hR1,"","Member 1");
	_ObjectCallMethod( items , "AddBar", h1,"Task","1/2/2008","1/7/2008");
	_ObjectCallMethod( items , "DefineSummaryBars", hR1,"",h1,"");
	h1 = _ObjectCallMethod( items , "InsertItem", hR1,"","Member 2");
	_ObjectCallMethod( items , "AddBar", h1,"Task","1/4/2008","1/9/2008");
	_ObjectCallMethod( items , "DefineSummaryBars", hR1,"",h1,"");
	h1 = _ObjectCallMethod( items , "InsertItem", hR1,"","Member 3");
	_ObjectCallMethod( items , "AddBar", h1,"Task","1/5/2008","1/10/2008");
	_ObjectCallMethod( items , "DefineSummaryBars", hR1,"",h1,"");
	_ObjectCallMethod(g2antt, "ExecuteTemplate", "iteObj.ExpandItem(hR1) = True");
	hR2 = _ObjectCallMethod( items , "InsertItem", hProject,"","Team 2");
	_ObjectCallMethod(g2antt, "TemplatePut", "Dim iteObj,hR2")
	_ObjectCallMethod(g2antt, "TemplatePut", items)
	_ObjectCallMethod(g2antt, "TemplatePut", hR2)
	_ObjectCallMethod(g2antt, "ExecuteTemplate", "iteObj.ItemHeight(hR2) = 30");
	_ObjectCallMethod( items , "AddBar", hR2,"Summary","1/2/2008","1/8/2008");
	_ObjectCallMethod(g2antt, "ExecuteTemplate", "iteObj.ItemBar(hR2,``,3) = `<br> Team <b>2</b> Summary `");
	h2 = _ObjectCallMethod( items , "InsertItem", hR2,"","Member 1");
	_ObjectCallMethod( items , "AddBar", h2,"Task","1/4/2008","1/7/2008");
	_ObjectCallMethod( items , "DefineSummaryBars", hR2,"",h2,"");
	h2 = _ObjectCallMethod( items , "InsertItem", hR2,"","Member 2");
	_ObjectCallMethod( items , "AddBar", h2,"Task","1/8/2008","1/11/2008");
	_ObjectCallMethod( items , "DefineSummaryBars", hR2,"",h2,"");
	h2 = _ObjectCallMethod( items , "InsertItem", hR2,"","Member 3");
	_ObjectCallMethod( items , "AddBar", h2,"Task","1/5/2008","1/12/2008");
	_ObjectCallMethod( items , "DefineSummaryBars", hR2,"",h2,"");
	_ObjectCallMethod(g2antt, "ExecuteTemplate", "iteObj.ExpandItem(hR2) = True");
	_ObjectCallMethod(g2antt, "TemplatePut", "Dim iteObj")
	_ObjectCallMethod(g2antt, "TemplatePut", items)
	_ObjectCallMethod(g2antt, "ExecuteTemplate", "iteObj.ExpandItem(FirstVisibleItem) = True");
	_ObjectCallMethod( items , "DefineSummaryBars", hProject,"",hR1,"");
	_ObjectCallMethod( items , "DefineSummaryBars", hProject,"",hR2,"");
_ObjectCallMethod( g2antt , "EndUpdate");
|
|
791
|
Is it possible to define level in terms of just increasing numbers (not a Date)
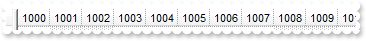
OBJECT chart,g2antt;

g2antt =  ObjectByName("AN1") ;
chart = _ObjectGetProperty( g2antt , "Chart");
	_ObjectCallMethod(g2antt, "TemplatePut", "Dim chaObj")
	_ObjectCallMethod(g2antt, "TemplatePut", chart)
	_ObjectCallMethod(g2antt, "ExecuteTemplate", "chaObj.PaneWidth(0) = 32");
	_ObjectSetProperty( chart , "UnitWidth", 32);
	_ObjectSetProperty( chart , "FirstVisibleDate", 1000);
	_ObjectCallMethod(g2antt, "ExecuteTemplate", "chaObj.Level(0).Label = `<%i%>`");
|
|
790
|
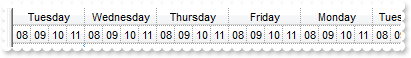
How can I hide the non-working units ( days or hours )
OBJECT chart,g2antt,level;

g2antt =  ObjectByName("AN1") ;
_ObjectCallMethod( g2antt , "BeginUpdate");
chart = _ObjectGetProperty( g2antt , "Chart");
	_ObjectCallMethod(g2antt, "TemplatePut", "Dim chaObj")
	_ObjectCallMethod(g2antt, "TemplatePut", chart)
	_ObjectCallMethod(g2antt, "ExecuteTemplate", "chaObj.PaneWidth(0) = 0");
	_ObjectSetProperty( chart , "LevelCount", 2);
	level = _ObjectCallMethod(g2antt, "ExecuteTemplate", "chaObj.Level(0)");
		_ObjectSetProperty( level , "Label", "<%dddd%>");
		_ObjectSetProperty( level , "Alignment", 1);
	_ObjectCallMethod(g2antt, "ExecuteTemplate", "chaObj.Level(1).Label = 65536");
	_ObjectSetProperty( chart , "NonworkingHours", 16773375);
	_ObjectSetProperty( chart , "ShowNonworkingUnits", 0);
	_ObjectSetProperty( chart , "ShowNonworkingDates", 0);
	_ObjectSetProperty( chart , "ShowNonworkingHours", 0);
_ObjectCallMethod( g2antt , "EndUpdate");
|
|
789
|
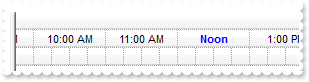
Is there a way to have the display show the word "Noon" instead "12:00 PM" in the chart's header/levels
OBJECT chart,g2antt,level;

g2antt =  ObjectByName("AN1") ;
chart = _ObjectGetProperty( g2antt , "Chart");
	_ObjectCallMethod(g2antt, "TemplatePut", "Dim chaObj")
	_ObjectCallMethod(g2antt, "TemplatePut", chart)
	_ObjectCallMethod(g2antt, "ExecuteTemplate", "chaObj.PaneWidth(False) = 0");
	_ObjectSetProperty( chart , "FirstVisibleDate", "1/1/2001 10:00:00 AM");
	_ObjectSetProperty( chart , "LevelCount", 3);
	level = _ObjectCallMethod(g2antt, "ExecuteTemplate", "chaObj.Level(0)");
		_ObjectSetProperty( level , "Label", "<b><%mmm%> <%d%>, <%yyyy%></b>");
		_ObjectSetProperty( level , "Alignment", 1);
		_ObjectSetProperty( level , "Unit", 4096);
	level = _ObjectCallMethod(g2antt, "ExecuteTemplate", "chaObj.Level(1)");
		_ObjectSetProperty( level , "Label", "<%h%>:00 <%AM/PM%>");
		_ObjectSetProperty( level , "Alignment", 1);
		_ObjectSetProperty( level , "Unit", 65536);
		_ObjectSetProperty( level , "DrawTickLines", -1);
		_ObjectSetProperty( level , "DrawGridLines", -1);
		_ObjectCallMethod(g2antt, "TemplatePut", "Dim levObj")
		_ObjectCallMethod(g2antt, "TemplatePut", level)
		_ObjectCallMethod(g2antt, "ExecuteTemplate", "levObj.ReplaceLabel(`12:00 PM`) = `<fgcolor=0000FF><b>Noon</b></fgcolor>`");
	level = _ObjectCallMethod(g2antt, "ExecuteTemplate", "chaObj.Level(2)");
		_ObjectSetProperty( level , "Label", "");
		_ObjectSetProperty( level , "Unit", 1048576);
		_ObjectSetProperty( level , "Count", 15);
|
|
788
|
How can I change the selection background color in the chart area
OBJECT g2antt,items;

g2antt =  ObjectByName("AN1") ;
_ObjectSetProperty( _ObjectGetProperty( g2antt , "Chart") , "FirstVisibleDate", "1/1/2001");
_ObjectSetProperty( _ObjectGetProperty( g2antt , "Chart") , "SelBackColor", 255);
_ObjectCallMethod( _ObjectGetProperty( g2antt , "Columns") , "Add", "Column");
items = _ObjectGetProperty( g2antt , "Items");
	_ObjectCallMethod( items , "AddBar", _ObjectCallMethod( items , "AddItem", "Item 1"),"Task","1/2/2001","1/4/2001");
	_ObjectCallMethod( items , "AddBar", _ObjectCallMethod( items , "AddItem", "Item 1"),"Task","1/6/2001","1/14/2001");
	_ObjectCallMethod(g2antt, "TemplatePut", "Dim iteObj")
	_ObjectCallMethod(g2antt, "TemplatePut", items)
	_ObjectCallMethod(g2antt, "ExecuteTemplate", "iteObj.SelectItem(FirstVisibleItem) = True");
|
|
787
|
How can I change the selection background color in the chart area
OBJECT g2antt,items;

g2antt =  ObjectByName("AN1") ;
_ObjectCallMethod( _ObjectGetProperty( g2antt , "VisualAppearance") , "Add", 1,"c:\exontrol\images\normal.ebn");
_ObjectSetProperty( _ObjectGetProperty( g2antt , "Chart") , "FirstVisibleDate", "1/1/2001");
_ObjectSetProperty( _ObjectGetProperty( g2antt , "Chart") , "SelBackColor", 16777216);
_ObjectCallMethod( _ObjectGetProperty( g2antt , "Columns") , "Add", "Column");
items = _ObjectGetProperty( g2antt , "Items");
	_ObjectCallMethod( items , "AddBar", _ObjectCallMethod( items , "AddItem", "Item 1"),"Task","1/2/2001","1/4/2001");
	_ObjectCallMethod( items , "AddBar", _ObjectCallMethod( items , "AddItem", "Item 1"),"Task","1/6/2001","1/14/2001");
	_ObjectCallMethod(g2antt, "TemplatePut", "Dim iteObj")
	_ObjectCallMethod(g2antt, "TemplatePut", items)
	_ObjectCallMethod(g2antt, "ExecuteTemplate", "iteObj.SelectItem(FirstVisibleItem) = True");
|
|
786
|
Is there any way to extend the selection on the chart
OBJECT g2antt,items;

g2antt =  ObjectByName("AN1") ;
_ObjectSetProperty( _ObjectGetProperty( g2antt , "Chart") , "FirstVisibleDate", "1/1/2001");
_ObjectSetProperty( _ObjectGetProperty( g2antt , "Chart") , "SelBackColor", _ObjectGetProperty( g2antt , "SelBackColor"));
_ObjectCallMethod( _ObjectGetProperty( g2antt , "Columns") , "Add", "Column");
items = _ObjectGetProperty( g2antt , "Items");
	_ObjectCallMethod( items , "AddBar", _ObjectCallMethod( items , "AddItem", "Item 1"),"Task","1/2/2001","1/4/2001");
	_ObjectCallMethod( items , "AddBar", _ObjectCallMethod( items , "AddItem", "Item 1"),"Task","1/6/2001","1/14/2001");
	_ObjectCallMethod(g2antt, "TemplatePut", "Dim iteObj")
	_ObjectCallMethod(g2antt, "TemplatePut", items)
	_ObjectCallMethod(g2antt, "ExecuteTemplate", "iteObj.SelectItem(FirstVisibleItem) = True");
|
|
785
|
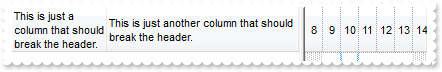
How can I display the column's header using multiple lines
OBJECT g2antt;

g2antt =  ObjectByName("AN1") ;
_ObjectSetProperty( g2antt , "HeaderHeight", 128);
_ObjectSetProperty( g2antt , "HeaderSingleLine", 0);
_ObjectSetProperty( _ObjectCallMethod( _ObjectGetProperty( g2antt , "Columns") , "Add", "This is just a column that should break the header.") , "Width", 32);
_ObjectCallMethod( _ObjectGetProperty( g2antt , "Columns") , "Add", "This is just another column that should break the header.");
|
|
784
|
Can I move or limit moving or resizing a bar
OBJECT chart,g2antt,items;

g2antt =  ObjectByName("AN1") ;
_ObjectCallMethod( g2antt , "BeginUpdate");
_ObjectSetProperty( g2antt , "ScrollBySingleLine", -1);
_ObjectSetProperty( g2antt , "DrawGridLines", -1);
_ObjectSetProperty( g2antt , "DefaultItemHeight", 19);
_ObjectSetProperty( g2antt , "GridLineColor", 14474460);
chart = _ObjectGetProperty( g2antt , "Chart");
	_ObjectSetProperty( chart , "FirstVisibleDate", "1/1/2001");
	_ObjectCallMethod(g2antt, "TemplatePut", "Dim chaObj")
	_ObjectCallMethod(g2antt, "TemplatePut", chart)
	_ObjectCallMethod(g2antt, "ExecuteTemplate", "chaObj.ScrollRange(0) = #12/28/2000#");
	_ObjectCallMethod(g2antt, "ExecuteTemplate", "chaObj.ScrollRange(1) = #1/12/2001#");
	_ObjectSetProperty( chart , "DrawDateTicker", -1);
	_ObjectSetProperty( chart , "NonworkingDays", 0);
	_ObjectSetProperty( chart , "DrawGridLines", -1);
	_ObjectSetProperty( chart , "ResizeUnitScale", 65536);
	_ObjectSetProperty( chart , "AllowCreateBar", 0);
	_ObjectCallMethod(g2antt, "ExecuteTemplate", "chaObj.PaneWidth(0) = 128");
	_ObjectSetProperty( chart , "LevelCount", 2);
	_ObjectCallMethod(g2antt, "ExecuteTemplate", "chaObj.Level(0).DrawGridLines = False");
	_ObjectSetProperty( chart , "AllowLinkBars", 0);
	_ObjectCallMethod(g2antt, "ExecuteTemplate", "chaObj.Bars.Item(`Task`).OverlaidType = 515");
_ObjectCallMethod( _ObjectGetProperty( g2antt , "Columns") , "Add", "Info");
items = _ObjectGetProperty( g2antt , "Items");
	h = _ObjectCallMethod( items , "AddItem", "Fixed bar");
	_ObjectCallMethod( items , "AddBar", h,"Task","1/2/2001","1/5/2001","F");
	_ObjectCallMethod(g2antt, "TemplatePut", "Dim iteObj,h")
	_ObjectCallMethod(g2antt, "TemplatePut", items)
	_ObjectCallMethod(g2antt, "TemplatePut", h)
	_ObjectCallMethod(g2antt, "ExecuteTemplate", "iteObj.ItemBar(h,`F`,10) = False");
	_ObjectCallMethod(g2antt, "ExecuteTemplate", "iteObj.ItemBar(h,`F`,11) = False");
	_ObjectCallMethod(g2antt, "ExecuteTemplate", "iteObj.ItemBar(h,`F`,6) = `This bar is fixed, so the uer can move or resize it`");
	h = _ObjectCallMethod( items , "AddItem", "Moveable but not-resizable bar");
	_ObjectCallMethod( items , "AddBar", h,"Task","1/3/2001","1/6/2001","F");
	_ObjectCallMethod(g2antt, "ExecuteTemplate", "iteObj.ItemBar(h,`F`,6) = `This bar is moveable inside the item, but the user can't resize it.`");
	_ObjectCallMethod(g2antt, "ExecuteTemplate", "iteObj.ItemBar(h,`F`,10) = False");
	h = _ObjectCallMethod( items , "AddItem", "Resizable but not moveable bar");
	_ObjectCallMethod( items , "AddBar", h,"Task","1/3/2001","1/6/2001","F");
	_ObjectCallMethod(g2antt, "ExecuteTemplate", "iteObj.ItemBar(h,`F`,6) = `This bar is resizable but the user can't move it.`");
	_ObjectCallMethod(g2antt, "ExecuteTemplate", "iteObj.ItemBar(h,`F`,11) = False");
	h = _ObjectCallMethod( items , "AddItem", "Range Moveable bar");
	_ObjectCallMethod( items , "AddBar", h,"Task","1/2/2001","1/6/2001","F");
	_ObjectCallMethod(g2antt, "ExecuteTemplate", "iteObj.ItemBar(h,`F`,6) = `This bar can be moved inside the displayed range.`");
	_ObjectCallMethod(g2antt, "ExecuteTemplate", "iteObj.ItemBar(h,`F`,22) = #1/2/2001#");
	_ObjectCallMethod(g2antt, "ExecuteTemplate", "iteObj.ItemBar(h,`F`,25) = #1/8/2001#");
	_ObjectCallMethod(g2antt, "ExecuteTemplate", "iteObj.ItemBar(h,`F`,26) = 32");
	_ObjectCallMethod(g2antt, "ExecuteTemplate", "iteObj.ItemBar(h,`F`,27) = 90");
	h = _ObjectCallMethod( items , "AddItem", "Range Moveable Upper No Limit bar");
	_ObjectCallMethod( items , "AddBar", h,"Task","1/3/2001","1/6/2001","F");
	_ObjectCallMethod(g2antt, "ExecuteTemplate", "iteObj.ItemBar(h,`F`,6) = `This bar can be moved inside the displayed range.`");
	_ObjectCallMethod(g2antt, "ExecuteTemplate", "iteObj.ItemBar(h,`F`,22) = #1/2/2001#");
	_ObjectCallMethod(g2antt, "ExecuteTemplate", "iteObj.ItemBar(h,`F`,26) = 32");
	_ObjectCallMethod(g2antt, "ExecuteTemplate", "iteObj.ItemBar(h,`F`,27) = 90");
	h = _ObjectCallMethod( items , "AddItem", "Range Moveable Lower No Limit bar");
	_ObjectCallMethod( items , "AddBar", h,"Task","1/3/2001","1/6/2001","F");
	_ObjectCallMethod(g2antt, "ExecuteTemplate", "iteObj.ItemBar(h,`F`,6) = `This bar can be moved inside the displayed range.`");
	_ObjectCallMethod(g2antt, "ExecuteTemplate", "iteObj.ItemBar(h,`F`,25) = #1/8/2001#");
	_ObjectCallMethod(g2antt, "ExecuteTemplate", "iteObj.ItemBar(h,`F`,26) = 32");
	_ObjectCallMethod(g2antt, "ExecuteTemplate", "iteObj.ItemBar(h,`F`,27) = 90");
	h = _ObjectCallMethod( items , "AddItem", "Moveable bar inside the item");
	_ObjectCallMethod( items , "AddBar", h,"Task","1/2/2001","1/6/2001","F");
	_ObjectCallMethod(g2antt, "ExecuteTemplate", "iteObj.ItemBar(h,`F`,6) = `This bar can be moved/resized anywhere inside the item.`");
	h = _ObjectCallMethod( items , "AddItem", "Moveable bar to other items too");
	_ObjectCallMethod( items , "AddBar", h,"Task","1/2/2001","1/6/2001","FA");
	_ObjectCallMethod(g2antt, "ExecuteTemplate", "iteObj.ItemBar(h,`FA`,6) = `This bar can be moved to other items too. Click the bar and move it to other items too.`");
	_ObjectCallMethod(g2antt, "ExecuteTemplate", "iteObj.ItemBar(h,`FA`,3) = `free`");
	_ObjectCallMethod(g2antt, "ExecuteTemplate", "iteObj.ItemBar(h,`FA`,4) = 18");
	_ObjectCallMethod(g2antt, "ExecuteTemplate", "iteObj.ItemBar(h,`FA`,28) = True");
	h = _ObjectCallMethod( items , "AddItem", "Moveable inside item");
	_ObjectCallMethod( items , "AddBar", h,"Task","1/3/2001","1/5/2001","F1");
	h = _ObjectCallMethod( items , "AddItem", "Moveable inside item");
	_ObjectCallMethod( items , "AddBar", h,"Task","1/3/2001","1/5/2001","F1");
	h = _ObjectCallMethod( items , "AddItem", "Moveable inside item");
	_ObjectCallMethod( items , "AddBar", h,"Task","1/3/2001","1/5/2001","F1");
_ObjectCallMethod( g2antt , "EndUpdate");
|
|
783
|
Can I move a bar from an item to another by drag and drop
OBJECT g2antt,items;

g2antt =  ObjectByName("AN1") ;
_ObjectSetProperty( _ObjectGetProperty( g2antt , "Chart") , "FirstVisibleDate", "1/1/2001");
_ObjectSetProperty( _ObjectGetProperty( g2antt , "Chart") , "AllowLinkBars", 0);
_ObjectCallMethod(g2antt, "ExecuteTemplate", "Chart.Bars.Item(`Task`).OverlaidType = 257");
_ObjectCallMethod( _ObjectGetProperty( g2antt , "Columns") , "Add", "Column");
items = _ObjectGetProperty( g2antt , "Items");
	_ObjectCallMethod( items , "AddBar", _ObjectCallMethod( items , "AddItem", "Item 1"),"Task","1/2/2001","1/4/2001","A");
	h = _ObjectCallMethod( items , "AddItem", "Item 2");
	_ObjectCallMethod( items , "AddBar", h,"Task","1/5/2001","1/7/2001","B");
	_ObjectCallMethod(g2antt, "TemplatePut", "Dim iteObj,h")
	_ObjectCallMethod(g2antt, "TemplatePut", items)
	_ObjectCallMethod(g2antt, "TemplatePut", h)
	_ObjectCallMethod(g2antt, "ExecuteTemplate", "iteObj.ItemBar(h,`B`,28) = True");
	_ObjectCallMethod( items , "AddItem", "Item 3");
	_ObjectCallMethod( items , "AddItem", "Item 4");
|
|
782
|
Can I move a bar from an item to another
OBJECT g2antt,items;

g2antt =  ObjectByName("AN1") ;
_ObjectSetProperty( _ObjectGetProperty( g2antt , "Chart") , "FirstVisibleDate", "1/1/2001");
_ObjectCallMethod( _ObjectGetProperty( g2antt , "Columns") , "Add", "Column");
items = _ObjectGetProperty( g2antt , "Items");
	_ObjectCallMethod( items , "AddBar", _ObjectCallMethod( items , "AddItem", "Item 1"),"Task","1/2/2001","1/4/2001","A");
	h = _ObjectCallMethod( items , "AddItem", "Item 2");
	_ObjectCallMethod( items , "AddBar", h,"Task","1/6/2001","1/14/2001","B");
	_ObjectCallMethod(g2antt, "TemplatePut", "Dim iteObj,h")
	_ObjectCallMethod(g2antt, "TemplatePut", items)
	_ObjectCallMethod(g2antt, "TemplatePut", h)
	_ObjectCallMethod(g2antt, "ExecuteTemplate", "iteObj.ItemBar(h,`B`,512) = FirstVisibleItem");
|
|
781
|
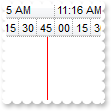
How can change the width, transparency, style, visual appearance ( EBN), of the vertical bar that shows the current date-time
OBJECT chart,g2antt,items,level;

g2antt =  ObjectByName("AN1") ;
_ObjectCallMethod( _ObjectGetProperty( g2antt , "VisualAppearance") , "Add", 1,"c:\exontrol\images\normal.ebn");
chart = _ObjectGetProperty( g2antt , "Chart");
	_ObjectSetProperty( chart , "LevelCount", 2);
	_ObjectCallMethod(g2antt, "TemplatePut", "Dim chaObj")
	_ObjectCallMethod(g2antt, "TemplatePut", chart)
	_ObjectCallMethod(g2antt, "ExecuteTemplate", "chaObj.Level(0).Label = 1048576");
	level = _ObjectCallMethod(g2antt, "ExecuteTemplate", "chaObj.Level(1)");
		_ObjectSetProperty( level , "Label", "<%ss%>");
		_ObjectSetProperty( level , "Count", 15);
	_ObjectSetProperty( chart , "MarkNowColor", 16777216);
	_ObjectSetProperty( chart , "MarkNowWidth", 6);
	_ObjectSetProperty( chart , "MarkNowTransparent", 50);
_ObjectCallMethod( _ObjectGetProperty( g2antt , "Columns") , "Add", "Tasks");
items = _ObjectGetProperty( g2antt , "Items");
	_ObjectCallMethod( items , "AddBar", _ObjectCallMethod( items , "AddItem", "Item 1"),"Task","1/1/2008","1/1/2018");
|
|
780
|
How can change the width, style, visual appearance ( EBN), of the vertical bar that shows the current time

OBJECT chart,g2antt,items,level;

g2antt =  ObjectByName("AN1") ;
_ObjectCallMethod( _ObjectGetProperty( g2antt , "VisualAppearance") , "Add", 1,"c:\exontrol\images\normal.ebn");
chart = _ObjectGetProperty( g2antt , "Chart");
	_ObjectSetProperty( chart , "LevelCount", 2);
	_ObjectCallMethod(g2antt, "TemplatePut", "Dim chaObj")
	_ObjectCallMethod(g2antt, "TemplatePut", chart)
	_ObjectCallMethod(g2antt, "ExecuteTemplate", "chaObj.Level(0).Label = 1048576");
	level = _ObjectCallMethod(g2antt, "ExecuteTemplate", "chaObj.Level(1)");
		_ObjectSetProperty( level , "Label", "<%ss%>");
		_ObjectSetProperty( level , "Count", 15);
	_ObjectSetProperty( chart , "MarkNowColor", 16777216);
	_ObjectSetProperty( chart , "MarkNowWidth", 6);
_ObjectCallMethod( _ObjectGetProperty( g2antt , "Columns") , "Add", "Tasks");
items = _ObjectGetProperty( g2antt , "Items");
	_ObjectCallMethod( items , "AddBar", _ObjectCallMethod( items , "AddItem", "Item 1"),"Task","1/1/2008","1/1/2018");
|
|
779
|
How can I show a vertical bar that indicates the current time
OBJECT chart,g2antt,items,level;

g2antt =  ObjectByName("AN1") ;
chart = _ObjectGetProperty( g2antt , "Chart");
	_ObjectSetProperty( chart , "LevelCount", 2);
	_ObjectCallMethod(g2antt, "TemplatePut", "Dim chaObj")
	_ObjectCallMethod(g2antt, "TemplatePut", chart)
	_ObjectCallMethod(g2antt, "ExecuteTemplate", "chaObj.Level(0).Label = 1048576");
	level = _ObjectCallMethod(g2antt, "ExecuteTemplate", "chaObj.Level(1)");
		_ObjectSetProperty( level , "Label", "<%ss%>");
		_ObjectSetProperty( level , "Count", 15);
	_ObjectSetProperty( chart , "MarkNowColor", 16711680);
	_ObjectSetProperty( chart , "MarkNowWidth", 7);
_ObjectCallMethod( _ObjectGetProperty( g2antt , "Columns") , "Add", "Tasks");
items = _ObjectGetProperty( g2antt , "Items");
	_ObjectCallMethod( items , "AddBar", _ObjectCallMethod( items , "AddItem", "Item 1"),"Task","1/1/2008","1/1/2018");
|
|
778
|
How can I show semi-transparent the vertical bar that indicates the current time
OBJECT chart,g2antt,items,level;

g2antt =  ObjectByName("AN1") ;
chart = _ObjectGetProperty( g2antt , "Chart");
	_ObjectSetProperty( chart , "LevelCount", 2);
	_ObjectCallMethod(g2antt, "TemplatePut", "Dim chaObj")
	_ObjectCallMethod(g2antt, "TemplatePut", chart)
	_ObjectCallMethod(g2antt, "ExecuteTemplate", "chaObj.Level(0).Label = 1048576");
	level = _ObjectCallMethod(g2antt, "ExecuteTemplate", "chaObj.Level(1)");
		_ObjectSetProperty( level , "Label", "<%ss%>");
		_ObjectSetProperty( level , "Count", 15);
	_ObjectSetProperty( chart , "MarkNowColor", 16711680);
	_ObjectSetProperty( chart , "MarkNowWidth", 7);
	_ObjectSetProperty( chart , "MarkNowTransparent", 50);
_ObjectCallMethod( _ObjectGetProperty( g2antt , "Columns") , "Add", "Tasks");
items = _ObjectGetProperty( g2antt , "Items");
	_ObjectCallMethod( items , "AddBar", _ObjectCallMethod( items , "AddItem", "Item 1"),"Task","1/1/2008","1/1/2018");
|
|
777
|
Is there any way to highlight or show a vertical bar that indicates the current time, from 15 to 15 seconds
OBJECT g2antt,level;

g2antt =  ObjectByName("AN1") ;
_ObjectSetProperty( _ObjectGetProperty( g2antt , "Chart") , "LevelCount", 2);
_ObjectCallMethod(g2antt, "ExecuteTemplate", "Chart.Level(0).Label = 1048576");
level = _ObjectCallMethod(g2antt, "ExecuteTemplate", "Chart.Level(1)");
	_ObjectSetProperty( level , "Label", "<%ss%>");
	_ObjectSetProperty( level , "Count", 15);
_ObjectSetProperty( _ObjectGetProperty( g2antt , "Chart") , "MarkNowColor", 16711680);
_ObjectSetProperty( _ObjectGetProperty( g2antt , "Chart") , "MarkNowCount", 15);
_ObjectSetProperty( _ObjectGetProperty( g2antt , "Chart") , "MarkNowWidth", 3);
|
|
776
|
Is there any way to highlight or show a vertical bar that indicates the current time, from minute to minute, hour and so on
OBJECT chart,g2antt;

g2antt =  ObjectByName("AN1") ;
chart = _ObjectGetProperty( g2antt , "Chart");
	_ObjectSetProperty( chart , "UnitWidth", 48);
	_ObjectSetProperty( chart , "LevelCount", 1);
	_ObjectCallMethod(g2antt, "TemplatePut", "Dim chaObj")
	_ObjectCallMethod(g2antt, "TemplatePut", chart)
	_ObjectCallMethod(g2antt, "ExecuteTemplate", "chaObj.Level(0).Label = 1048576");
	_ObjectSetProperty( chart , "MarkNowColor", 255);
	_ObjectSetProperty( chart , "MarkNowUnit", 1048576);
	_ObjectSetProperty( chart , "MarkNowWidth", _ObjectGetProperty( chart , "UnitWidth"));
|
|
775
|
Is there any way to highlight or show a vertical bar that indicates the current time
OBJECT g2antt,level;

g2antt =  ObjectByName("AN1") ;
_ObjectSetProperty( _ObjectGetProperty( g2antt , "Chart") , "LevelCount", 2);
_ObjectCallMethod(g2antt, "ExecuteTemplate", "Chart.Level(0).Label = 1048576");
level = _ObjectCallMethod(g2antt, "ExecuteTemplate", "Chart.Level(1)");
	_ObjectSetProperty( level , "Label", "<%ss%>");
	_ObjectSetProperty( level , "Count", 15);
_ObjectSetProperty( _ObjectGetProperty( g2antt , "Chart") , "MarkNowColor", 255);
|
|
774
|
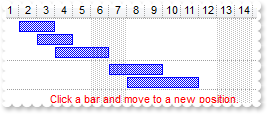
Is there a way of making a bar flash on the screen
OBJECT g2antt,items;

g2antt =  ObjectByName("AN1") ;
_ObjectCallMethod( _ObjectGetProperty( g2antt , "Columns") , "Add", "Task");
_ObjectSetProperty( _ObjectGetProperty( g2antt , "Chart") , "FirstVisibleDate", "1/1/2001");
items = _ObjectGetProperty( g2antt , "Items");
	h = _ObjectCallMethod( items , "AddItem", "Flashy task");
	_ObjectCallMethod( items , "AddBar", h,"Task","1/2/2001","1/6/2001","K1");
	_ObjectCallMethod(g2antt, "TemplatePut", "Dim iteObj,h")
	_ObjectCallMethod(g2antt, "TemplatePut", items)
	_ObjectCallMethod(g2antt, "TemplatePut", h)
	_ObjectCallMethod(g2antt, "ExecuteTemplate", "iteObj.ItemBar(h,`K1`,19) = 80");
|
|
773
|
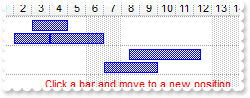
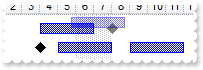
Is there any option to display overlay bars as a stack, or bars that laid over or cover other bars (exOverlaidBarsStackAutoArrange)
OBJECT bar,chart,g2antt,items;

g2antt =  ObjectByName("AN1") ;
_ObjectCallMethod( g2antt , "BeginUpdate");
_ObjectSetProperty( g2antt , "ScrollBySingleLine", -1);
_ObjectCallMethod( _ObjectGetProperty( g2antt , "Columns") , "Add", "Task");
_ObjectSetProperty( g2antt , "DrawGridLines", 1);
chart = _ObjectGetProperty( g2antt , "Chart");
	_ObjectSetProperty( chart , "DrawGridLines", 1);
	_ObjectSetProperty( chart , "AllowCreateBar", 1);
	_ObjectSetProperty( chart , "AllowLinkBars", 0);
	_ObjectSetProperty( chart , "ResizeUnitScale", 65536);
	_ObjectCallMethod(g2antt, "TemplatePut", "Dim chaObj")
	_ObjectCallMethod(g2antt, "TemplatePut", chart)
	_ObjectCallMethod(g2antt, "ExecuteTemplate", "chaObj.PaneWidth(False) = 48");
	_ObjectSetProperty( chart , "FirstVisibleDate", "1/1/2001");
	bar = _ObjectCallMethod(g2antt, "ExecuteTemplate", "chaObj.Bars.Item(`Task`)");
		_ObjectSetProperty( bar , "OverlaidType", 515);
		_ObjectCallMethod(g2antt, "TemplatePut", "Dim barObj")
		_ObjectCallMethod(g2antt, "TemplatePut", bar)
		_ObjectCallMethod(g2antt, "ExecuteTemplate", "barObj.Overlaid(256) = 80");
items = _ObjectGetProperty( g2antt , "Items");
	h = _ObjectCallMethod( items , "AddItem", "Task 1");
	_ObjectCallMethod( items , "AddBar", h,"Task","1/2/2001","1/4/2001","A1");
	_ObjectCallMethod( items , "AddBar", h,"Task","1/3/2001","1/5/2001","A2");
	_ObjectCallMethod( items , "AddBar", h,"Task","1/4/2001","1/7/2001","A3");
	h = _ObjectCallMethod( items , "AddItem", "Task 2");
	_ObjectCallMethod( items , "AddBar", h,"Task","1/7/2001","1/10/2001","A1");
	_ObjectCallMethod( items , "AddBar", h,"Task","1/8/2001","1/12/2001","A3");
	h = _ObjectCallMethod( items , "AddItem", );
	_ObjectCallMethod(g2antt, "TemplatePut", "Dim iteObj,h")
	_ObjectCallMethod(g2antt, "TemplatePut", items)
	_ObjectCallMethod(g2antt, "TemplatePut", h)
	_ObjectCallMethod(g2antt, "ExecuteTemplate", "iteObj.SelectableItem(h) = False");
	_ObjectCallMethod( items , "AddBar", h,"","1/7/2001","1/11/2001","","<fgcolor=FF0000>Click a bar and move to a new position.");
_ObjectCallMethod( g2antt , "EndUpdate");
|
|
772
|
Is there any option to display overlay bars as a stack, or bars that laid over or cover other bars (overlay)
OBJECT chart,g2antt,items;

g2antt =  ObjectByName("AN1") ;
_ObjectCallMethod( g2antt , "BeginUpdate");
_ObjectSetProperty( g2antt , "ScrollBySingleLine", -1);
_ObjectCallMethod( _ObjectGetProperty( g2antt , "Columns") , "Add", "Task");
_ObjectSetProperty( g2antt , "DrawGridLines", 1);
chart = _ObjectGetProperty( g2antt , "Chart");
	_ObjectSetProperty( chart , "DrawGridLines", 1);
	_ObjectSetProperty( chart , "AllowCreateBar", 1);
	_ObjectSetProperty( chart , "AllowLinkBars", 0);
	_ObjectSetProperty( chart , "ResizeUnitScale", 65536);
	_ObjectCallMethod(g2antt, "TemplatePut", "Dim chaObj")
	_ObjectCallMethod(g2antt, "TemplatePut", chart)
	_ObjectCallMethod(g2antt, "ExecuteTemplate", "chaObj.PaneWidth(False) = 48");
	_ObjectSetProperty( chart , "FirstVisibleDate", "1/1/2001");
	_ObjectCallMethod(g2antt, "ExecuteTemplate", "chaObj.Bars.Item(`Task`).OverlaidType = 3");
items = _ObjectGetProperty( g2antt , "Items");
	h = _ObjectCallMethod( items , "AddItem", "Task 1");
	_ObjectCallMethod( items , "AddBar", h,"Task","1/2/2001","1/4/2001","A1");
	_ObjectCallMethod( items , "AddBar", h,"Task","1/3/2001","1/5/2001","A2");
	_ObjectCallMethod( items , "AddBar", h,"Task","1/4/2001","1/7/2001","A3");
	h = _ObjectCallMethod( items , "AddItem", "Task 2");
	_ObjectCallMethod( items , "AddBar", h,"Task","1/7/2001","1/10/2001","A1");
	_ObjectCallMethod( items , "AddBar", h,"Task","1/8/2001","1/12/2001","A3");
	h = _ObjectCallMethod( items , "AddItem", );
	_ObjectCallMethod(g2antt, "TemplatePut", "Dim iteObj,h")
	_ObjectCallMethod(g2antt, "TemplatePut", items)
	_ObjectCallMethod(g2antt, "TemplatePut", h)
	_ObjectCallMethod(g2antt, "ExecuteTemplate", "iteObj.SelectableItem(h) = False");
	_ObjectCallMethod( items , "AddBar", h,"","1/7/2001","1/11/2001","","<fgcolor=FF0000>Click a bar and move to a new position.");
_ObjectCallMethod( g2antt , "EndUpdate");
|
|
771
|
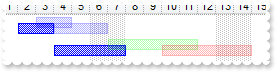
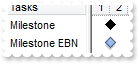
Does the overlay also work in milestone bars
OBJECT bar,bars,chart,g2antt,items;

g2antt =  ObjectByName("AN1") ;
_ObjectCallMethod( g2antt , "BeginUpdate");
_ObjectSetProperty( g2antt , "DefaultItemHeight", 22);
_ObjectCallMethod( _ObjectGetProperty( g2antt , "Columns") , "Add", "Task");
chart = _ObjectGetProperty( g2antt , "Chart");
	_ObjectSetProperty( chart , "ResizeUnitScale", 65536);
	_ObjectCallMethod(g2antt, "TemplatePut", "Dim chaObj")
	_ObjectCallMethod(g2antt, "TemplatePut", chart)
	_ObjectCallMethod(g2antt, "ExecuteTemplate", "chaObj.PaneWidth(False) = 48");
	_ObjectSetProperty( chart , "FirstVisibleDate", "1/1/2001");
	bars = _ObjectGetProperty( chart , "Bars");
		bar = _ObjectCallMethod(g2antt, "ExecuteTemplate", "barObj.Item(`Task`)");
			_ObjectSetProperty( bar , "OverlaidType", 257);
			_ObjectSetProperty( bar , "OverlaidGroup", "Milestone");
		bar = _ObjectCallMethod(g2antt, "ExecuteTemplate", "barObj.Item(`Milestone`)");
			_ObjectSetProperty( bar , "OverlaidType", 257);
			_ObjectSetProperty( bar , "OverlaidGroup", "Task");
items = _ObjectGetProperty( g2antt , "Items");
	h = _ObjectCallMethod( items , "AddItem", "Task 1");
	_ObjectCallMethod( items , "AddBar", h,"Task","1/4/2001","1/7/2001","A1");
	_ObjectCallMethod( items , "AddBar", h,"Milestone","1/8/2001","1/8/2001","M");
	_ObjectCallMethod( items , "AddBar", h,"Task","1/9/2001","1/12/2001","A3");
	h = _ObjectCallMethod( items , "AddItem", "Task 2");
	_ObjectCallMethod( items , "AddBar", h,"Milestone","1/4/2001","1/4/2001","M");
	_ObjectCallMethod( items , "AddBar", h,"Task","1/5/2001","1/8/2001","A1");
	_ObjectCallMethod( items , "AddBar", h,"Task","1/9/2001","1/12/2001","A3");
	h = _ObjectCallMethod( items , "AddItem", );
	_ObjectCallMethod(g2antt, "TemplatePut", "Dim iteObj,h")
	_ObjectCallMethod(g2antt, "TemplatePut", items)
	_ObjectCallMethod(g2antt, "TemplatePut", h)
	_ObjectCallMethod(g2antt, "ExecuteTemplate", "iteObj.SelectableItem(h) = False");
	_ObjectCallMethod( items , "AddBar", h,"","1/7/2001","1/11/2001","","<fgcolor=FF0000>Click a bar and move to a new position.");
_ObjectCallMethod( g2antt , "EndUpdate");
|
|
770
|
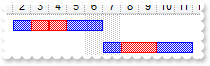
Is there any option to display overlaid bars of different types, or bars that laid over or cover other bars (overlay)
OBJECT bar,bars,chart,g2antt,items;

g2antt =  ObjectByName("AN1") ;
_ObjectSetProperty( g2antt , "DefaultItemHeight", 22);
_ObjectCallMethod( _ObjectGetProperty( g2antt , "Columns") , "Add", "Task");
chart = _ObjectGetProperty( g2antt , "Chart");
	_ObjectSetProperty( chart , "ResizeUnitScale", 65536);
	_ObjectCallMethod(g2antt, "TemplatePut", "Dim chaObj")
	_ObjectCallMethod(g2antt, "TemplatePut", chart)
	_ObjectCallMethod(g2antt, "ExecuteTemplate", "chaObj.PaneWidth(False) = 48");
	_ObjectSetProperty( chart , "FirstVisibleDate", "1/1/2001");
	bars = _ObjectGetProperty( chart , "Bars");
		_ObjectSetProperty( _ObjectCallMethod( bars , "Copy", "Task","RTask") , "Color", 255);
		_ObjectSetProperty( _ObjectCallMethod( bars , "Copy", "Task","GTask") , "Color", 65280);
		bar = _ObjectCallMethod(g2antt, "ExecuteTemplate", "barObj.Item(`Task`)");
			_ObjectSetProperty( bar , "OverlaidType", 257);
			_ObjectCallMethod(g2antt, "TemplatePut", "Dim barObj")
			_ObjectCallMethod(g2antt, "TemplatePut", bar)
			_ObjectCallMethod(g2antt, "ExecuteTemplate", "barObj.Overlaid(256) = 70");
			_ObjectSetProperty( bar , "OverlaidGroup", "RTask,GTask");
items = _ObjectGetProperty( g2antt , "Items");
	h = _ObjectCallMethod( items , "AddItem", "Task 1");
	_ObjectCallMethod( items , "AddBar", h,"Task","1/2/2001","1/4/2001","A1");
	_ObjectCallMethod( items , "AddBar", h,"Task","1/3/2001","1/5/2001","A2");
	_ObjectCallMethod( items , "AddBar", h,"Task","1/4/2001","1/7/2001","A3");
	h = _ObjectCallMethod( items , "AddItem", "Task 2");
	_ObjectCallMethod( items , "AddBar", h,"Task","1/4/2001","1/8/2001","A1");
	_ObjectCallMethod( items , "AddBar", h,"GTask","1/7/2001","1/12/2001","A2");
	_ObjectCallMethod( items , "AddBar", h,"RTask","1/10/2001","1/15/2001","A3");
	h = _ObjectCallMethod( items , "AddItem", );
	_ObjectCallMethod(g2antt, "TemplatePut", "Dim iteObj,h")
	_ObjectCallMethod(g2antt, "TemplatePut", items)
	_ObjectCallMethod(g2antt, "TemplatePut", h)
	_ObjectCallMethod(g2antt, "ExecuteTemplate", "iteObj.SelectableItem(h) = False");
	_ObjectCallMethod( items , "AddBar", h,"","1/7/2001","1/11/2001","","<fgcolor=FF0000>Click a bar and move to a new position.");
|
|
769
|
Is there any option to display overlaid bars, or bars that laid over or cover other bars (overlay)
OBJECT bar,bars,chart,g2antt,items;

g2antt =  ObjectByName("AN1") ;
_ObjectSetProperty( g2antt , "DefaultItemHeight", 22);
_ObjectCallMethod( _ObjectGetProperty( g2antt , "Columns") , "Add", "Task");
chart = _ObjectGetProperty( g2antt , "Chart");
	_ObjectSetProperty( chart , "ResizeUnitScale", 65536);
	_ObjectCallMethod(g2antt, "TemplatePut", "Dim chaObj")
	_ObjectCallMethod(g2antt, "TemplatePut", chart)
	_ObjectCallMethod(g2antt, "ExecuteTemplate", "chaObj.PaneWidth(False) = 48");
	_ObjectSetProperty( chart , "FirstVisibleDate", "1/1/2001");
	bars = _ObjectGetProperty( chart , "Bars");
		bar = _ObjectCallMethod( bars , "Copy", "Task","BTask");
			_ObjectSetProperty( bar , "Color", 255);
		bar = _ObjectCallMethod(g2antt, "ExecuteTemplate", "barObj.Item(`Task`)");
			_ObjectSetProperty( bar , "OverlaidType", 2);
			_ObjectCallMethod(g2antt, "TemplatePut", "Dim barObj")
			_ObjectCallMethod(g2antt, "TemplatePut", bar)
			_ObjectCallMethod(g2antt, "ExecuteTemplate", "barObj.Overlaid(2) = `BTask`");
items = _ObjectGetProperty( g2antt , "Items");
	h = _ObjectCallMethod( items , "AddItem", "Task 1");
	_ObjectCallMethod( items , "AddBar", h,"Task","1/2/2001","1/4/2001","A1");
	_ObjectCallMethod( items , "AddBar", h,"Task","1/3/2001","1/5/2001","A2");
	_ObjectCallMethod( items , "AddBar", h,"Task","1/4/2001","1/7/2001","A3");
	h = _ObjectCallMethod( items , "AddItem", "Task 2");
	_ObjectCallMethod( items , "AddBar", h,"Task","1/7/2001","1/10/2001","A1");
	_ObjectCallMethod( items , "AddBar", h,"Task","1/8/2001","1/12/2001","A3");
	h = _ObjectCallMethod( items , "AddItem", );
	_ObjectCallMethod(g2antt, "TemplatePut", "Dim iteObj,h")
	_ObjectCallMethod(g2antt, "TemplatePut", items)
	_ObjectCallMethod(g2antt, "TemplatePut", h)
	_ObjectCallMethod(g2antt, "ExecuteTemplate", "iteObj.SelectableItem(h) = False");
	_ObjectCallMethod( items , "AddBar", h,"","1/7/2001","1/11/2001","","<fgcolor=FF0000>Click a bar and move to a new position.");
|
|
768
|
Is there any option to display overlaid bars, or bars that laid over or cover other bars (overlay)
OBJECT bar,chart,g2antt,items;

g2antt =  ObjectByName("AN1") ;
_ObjectSetProperty( g2antt , "DefaultItemHeight", 22);
_ObjectCallMethod( _ObjectGetProperty( g2antt , "Columns") , "Add", "Task");
chart = _ObjectGetProperty( g2antt , "Chart");
	_ObjectSetProperty( chart , "ResizeUnitScale", 65536);
	_ObjectCallMethod(g2antt, "TemplatePut", "Dim chaObj")
	_ObjectCallMethod(g2antt, "TemplatePut", chart)
	_ObjectCallMethod(g2antt, "ExecuteTemplate", "chaObj.PaneWidth(False) = 48");
	_ObjectSetProperty( chart , "FirstVisibleDate", "1/1/2001");
	bar = _ObjectCallMethod(g2antt, "ExecuteTemplate", "chaObj.Bars.Item(`Task`)");
		_ObjectSetProperty( bar , "OverlaidType", 257);
		_ObjectCallMethod(g2antt, "TemplatePut", "Dim barObj")
		_ObjectCallMethod(g2antt, "TemplatePut", bar)
		_ObjectCallMethod(g2antt, "ExecuteTemplate", "barObj.Overlaid(256) = 70");
items = _ObjectGetProperty( g2antt , "Items");
	h = _ObjectCallMethod( items , "AddItem", "Task 1");
	_ObjectCallMethod( items , "AddBar", h,"Task","1/2/2001","1/4/2001","A1");
	_ObjectCallMethod( items , "AddBar", h,"Task","1/3/2001","1/5/2001","A2");
	_ObjectCallMethod( items , "AddBar", h,"Task","1/4/2001","1/7/2001","A3");
	h = _ObjectCallMethod( items , "AddItem", "Task 2");
	_ObjectCallMethod( items , "AddBar", h,"Task","1/7/2001","1/10/2001","A1");
	_ObjectCallMethod( items , "AddBar", h,"Task","1/8/2001","1/12/2001","A3");
	h = _ObjectCallMethod( items , "AddItem", );
	_ObjectCallMethod(g2antt, "TemplatePut", "Dim iteObj,h")
	_ObjectCallMethod(g2antt, "TemplatePut", items)
	_ObjectCallMethod(g2antt, "TemplatePut", h)
	_ObjectCallMethod(g2antt, "ExecuteTemplate", "iteObj.SelectableItem(h) = False");
	_ObjectCallMethod( items , "AddBar", h,"","1/7/2001","1/11/2001","","<fgcolor=FF0000>Click a bar and move to a new position.");
|
|
767
|
Is there any option to display overlaid bars, or bars that laid over or cover other bars (overlay)
OBJECT chart,g2antt,items;

g2antt =  ObjectByName("AN1") ;
_ObjectSetProperty( g2antt , "DefaultItemHeight", 22);
_ObjectCallMethod( _ObjectGetProperty( g2antt , "Columns") , "Add", "Task");
chart = _ObjectGetProperty( g2antt , "Chart");
	_ObjectSetProperty( chart , "ResizeUnitScale", 65536);
	_ObjectCallMethod(g2antt, "TemplatePut", "Dim chaObj")
	_ObjectCallMethod(g2antt, "TemplatePut", chart)
	_ObjectCallMethod(g2antt, "ExecuteTemplate", "chaObj.PaneWidth(False) = 48");
	_ObjectSetProperty( chart , "FirstVisibleDate", "1/1/2001");
	_ObjectCallMethod(g2antt, "ExecuteTemplate", "chaObj.Bars.Item(`Task`).OverlaidType = 1");
items = _ObjectGetProperty( g2antt , "Items");
	h = _ObjectCallMethod( items , "AddItem", "Task 1");
	_ObjectCallMethod( items , "AddBar", h,"Task","1/2/2001","1/4/2001","A1");
	_ObjectCallMethod( items , "AddBar", h,"Task","1/3/2001","1/5/2001","A2");
	_ObjectCallMethod( items , "AddBar", h,"Task","1/4/2001","1/7/2001","A3");
	h = _ObjectCallMethod( items , "AddItem", "Task 2");
	_ObjectCallMethod( items , "AddBar", h,"Task","1/7/2001","1/10/2001","A1");
	_ObjectCallMethod( items , "AddBar", h,"Task","1/8/2001","1/12/2001","A3");
	h = _ObjectCallMethod( items , "AddItem", );
	_ObjectCallMethod(g2antt, "TemplatePut", "Dim iteObj,h")
	_ObjectCallMethod(g2antt, "TemplatePut", items)
	_ObjectCallMethod(g2antt, "TemplatePut", h)
	_ObjectCallMethod(g2antt, "ExecuteTemplate", "iteObj.SelectableItem(h) = False");
	_ObjectCallMethod( items , "AddBar", h,"","1/7/2001","1/11/2001","","<fgcolor=FF0000>Click a bar and move to a new position.");
|
|
766
|
How can include the values in the inner cells in the drop down filter window
OBJECT column,g2antt,items;

g2antt =  ObjectByName("AN1") ;
_ObjectSetProperty( g2antt , "DrawGridLines", -2);
_ObjectCallMethod( _ObjectGetProperty( g2antt , "VisualAppearance") , "Add", 1,"c:\exontrol\images\normal.ebn");
_ObjectCallMethod(g2antt, "ExecuteTemplate", "Description(1) = ``");
_ObjectCallMethod(g2antt, "ExecuteTemplate", "Description(2) = ``");
column = _ObjectCallMethod( _ObjectGetProperty( g2antt , "Columns") , "Add", "Single Column");
	_ObjectSetProperty( column , "HTMLCaption", "Single column with <b>inner cells</b>");
	_ObjectSetProperty( column , "ToolTip", "Click the drop down filter button, and the filter list includes the inner cells values too.");
	_ObjectSetProperty( column , "DisplayFilterButton", -1);
	_ObjectSetProperty( column , "DisplayFilterPattern", 0);
	_ObjectSetProperty( column , "FilterList", 64);
_ObjectSetProperty( g2antt , "ShowFocusRect", 0);
items = _ObjectGetProperty( g2antt , "Items");
	_ObjectCallMethod(g2antt, "TemplatePut", "Dim iteObj")
	_ObjectCallMethod(g2antt, "TemplatePut", items)
	s = _ObjectCallMethod(g2antt, "ExecuteTemplate", "iteObj.SplitCell(AddItem(`S 1.1`),0)");
	_ObjectCallMethod(g2antt, "TemplatePut", "Dim iteObj,s")
	_ObjectCallMethod(g2antt, "TemplatePut", items)
	_ObjectCallMethod(g2antt, "TemplatePut", s)
	_ObjectCallMethod(g2antt, "ExecuteTemplate", "iteObj.CellValue(,s) = `S 1.2`");
	_ObjectCallMethod(g2antt, "ExecuteTemplate", "iteObj.CellHAlignment(,s) = 1");
	_ObjectCallMethod(g2antt, "ExecuteTemplate", "iteObj.CellBackColor(,s) = 16777216");
	_ObjectCallMethod(g2antt, "ExecuteTemplate", "iteObj.CellWidth(,s) = 84");
	_ObjectCallMethod(g2antt, "TemplatePut", "Dim iteObj")
	_ObjectCallMethod(g2antt, "TemplatePut", items)
	s = _ObjectCallMethod(g2antt, "ExecuteTemplate", "iteObj.SplitCell(AddItem(`S 2.1`),0)");
	_ObjectCallMethod(g2antt, "TemplatePut", "Dim iteObj,s")
	_ObjectCallMethod(g2antt, "TemplatePut", items)
	_ObjectCallMethod(g2antt, "TemplatePut", s)
	_ObjectCallMethod(g2antt, "ExecuteTemplate", "iteObj.CellValue(,s) = `S 2.2`");
	_ObjectCallMethod(g2antt, "ExecuteTemplate", "iteObj.CellHAlignment(,s) = 1");
	_ObjectCallMethod(g2antt, "ExecuteTemplate", "iteObj.CellWidth(,s) = 84");
	_ObjectCallMethod(g2antt, "TemplatePut", "Dim iteObj")
	_ObjectCallMethod(g2antt, "TemplatePut", items)
	s = _ObjectCallMethod(g2antt, "ExecuteTemplate", "iteObj.SplitCell(AddItem(`S 3.1`),0)");
	_ObjectCallMethod(g2antt, "TemplatePut", "Dim iteObj,s")
	_ObjectCallMethod(g2antt, "TemplatePut", items)
	_ObjectCallMethod(g2antt, "TemplatePut", s)
	_ObjectCallMethod(g2antt, "ExecuteTemplate", "iteObj.CellValue(,s) = `S 3.2`");
	_ObjectCallMethod(g2antt, "ExecuteTemplate", "iteObj.CellHAlignment(,s) = 1");
	_ObjectCallMethod(g2antt, "ExecuteTemplate", "iteObj.CellBackColor(,s) = 16777216");
	_ObjectCallMethod(g2antt, "ExecuteTemplate", "iteObj.CellWidth(,s) = 84");
|
|
765
|
How can I sort the value gets listed in the drop down filter window
OBJECT column,g2antt,items;

g2antt =  ObjectByName("AN1") ;
_ObjectSetProperty( g2antt , "LinesAtRoot", -1);
_ObjectSetProperty( g2antt , "MarkSearchColumn", 0);
_ObjectCallMethod(g2antt, "ExecuteTemplate", "Description(0) = ``");
_ObjectCallMethod(g2antt, "ExecuteTemplate", "Description(1) = ``");
_ObjectCallMethod(g2antt, "ExecuteTemplate", "Description(2) = ``");
column = _ObjectCallMethod( _ObjectGetProperty( g2antt , "Columns") , "Add", "P1");
	_ObjectSetProperty( column , "DisplayFilterButton", -1);
	_ObjectSetProperty( column , "DisplayFilterPattern", 0);
	_ObjectSetProperty( column , "FilterList", 16);
column = _ObjectCallMethod( _ObjectGetProperty( g2antt , "Columns") , "Add", "P2");
	_ObjectSetProperty( column , "DisplayFilterButton", -1);
	_ObjectSetProperty( column , "DisplayFilterPattern", 0);
	_ObjectSetProperty( column , "FilterList", 32);
items = _ObjectGetProperty( g2antt , "Items");
	h = _ObjectCallMethod( items , "AddItem", "Z3");
	_ObjectCallMethod(g2antt, "TemplatePut", "Dim iteObj,h")
	_ObjectCallMethod(g2antt, "TemplatePut", items)
	_ObjectCallMethod(g2antt, "TemplatePut", h)
	_ObjectCallMethod(g2antt, "ExecuteTemplate", "iteObj.CellValue(h,1) = `C`");
	_ObjectCallMethod(g2antt, "ExecuteTemplate", "iteObj.CellValue(InsertItem(h,,`Z1`),1) = `B`");
	_ObjectCallMethod(g2antt, "ExecuteTemplate", "iteObj.CellValue(InsertItem(h,,`Z2`),1) = `A`");
	_ObjectCallMethod(g2antt, "ExecuteTemplate", "iteObj.ExpandItem(h) = True");
|
|
764
|
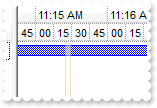
Is there a way to break the hours into 15 minute increments just showing lines instead of the minute numbers
OBJECT g2antt,level;

g2antt =  ObjectByName("AN1") ;
_ObjectCallMethod( g2antt , "BeginUpdate");
_ObjectSetProperty( _ObjectGetProperty( g2antt , "Chart") , "FirstVisibleDate", "2/5/2008");
_ObjectSetProperty( _ObjectGetProperty( g2antt , "Chart") , "LevelCount", 3);
_ObjectCallMethod(g2antt, "ExecuteTemplate", "Chart.Level(0).Label = `<b><%mmm%> <%dd%></b> <%yyyy%> `");
level = _ObjectCallMethod(g2antt, "ExecuteTemplate", "Chart.Level(1)");
	_ObjectSetProperty( level , "Label", "<%hh%>");
	_ObjectSetProperty( level , "Alignment", 1);
level = _ObjectCallMethod(g2antt, "ExecuteTemplate", "Chart.Level(2)");
	_ObjectSetProperty( level , "Label", "");
	_ObjectSetProperty( level , "Unit", 1048576);
	_ObjectSetProperty( level , "Count", 15);
_ObjectSetProperty( _ObjectGetProperty( g2antt , "Chart") , "UnitWidth", 6);
_ObjectCallMethod( g2antt , "EndUpdate");
|
|
763
|
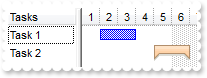
How do I specify a range where the bar can be moved or resized and to highlight the range
OBJECT g2antt,items;

g2antt =  ObjectByName("AN1") ;
_ObjectCallMethod( g2antt , "BeginUpdate");
_ObjectCallMethod( _ObjectGetProperty( g2antt , "VisualAppearance") , "Add", 1,"c:\exontrol\images\normal.ebn");
_ObjectSetProperty( _ObjectGetProperty( g2antt , "Chart") , "FirstVisibleDate", "1/1/2001");
_ObjectCallMethod(g2antt, "ExecuteTemplate", "Chart.ScrollRange(0) = #1/1/2001#");
_ObjectCallMethod(g2antt, "ExecuteTemplate", "Chart.ScrollRange(1) = #1/7/2001#");
_ObjectCallMethod(g2antt, "ExecuteTemplate", "Chart.PaneWidth(0) = 128");
_ObjectCallMethod( _ObjectGetProperty( g2antt , "Columns") , "Add", "Column");
items = _ObjectGetProperty( g2antt , "Items");
	h = _ObjectCallMethod( items , "AddItem", "Item 1");
	_ObjectCallMethod( items , "AddBar", h,"Task","1/1/2001","1/4/2001");
	_ObjectCallMethod(g2antt, "TemplatePut", "Dim iteObj,h")
	_ObjectCallMethod(g2antt, "TemplatePut", items)
	_ObjectCallMethod(g2antt, "TemplatePut", h)
	_ObjectCallMethod(g2antt, "ExecuteTemplate", "iteObj.ItemBar(h,``,22) = #1/2/2001#");
	_ObjectCallMethod(g2antt, "ExecuteTemplate", "iteObj.ItemBar(h,``,25) = #1/8/2001#");
	_ObjectCallMethod(g2antt, "ExecuteTemplate", "iteObj.ItemBar(h,``,26) = 16777216");
	_ObjectCallMethod(g2antt, "ExecuteTemplate", "iteObj.ItemBar(h,``,27) = 60");
	h = _ObjectCallMethod( items , "AddItem", "Item 2");
	_ObjectCallMethod( items , "AddBar", h,"Task","1/1/2001","1/4/2001");
_ObjectCallMethod( g2antt , "EndUpdate");
|
|
762
|
How do I specify a range where the bar can be moved or resized and to highlight the range
OBJECT g2antt,items;

g2antt =  ObjectByName("AN1") ;
_ObjectCallMethod( g2antt , "BeginUpdate");
_ObjectSetProperty( _ObjectGetProperty( g2antt , "Chart") , "FirstVisibleDate", "1/1/2001");
_ObjectCallMethod(g2antt, "ExecuteTemplate", "Chart.ScrollRange(0) = #1/1/2001#");
_ObjectCallMethod(g2antt, "ExecuteTemplate", "Chart.ScrollRange(1) = #1/7/2001#");
_ObjectCallMethod(g2antt, "ExecuteTemplate", "Chart.PaneWidth(0) = 128");
_ObjectCallMethod( _ObjectGetProperty( g2antt , "Columns") , "Add", "Column");
items = _ObjectGetProperty( g2antt , "Items");
	h = _ObjectCallMethod( items , "AddItem", "Item 1");
	_ObjectCallMethod( items , "AddBar", h,"Task","1/1/2001","1/4/2001");
	_ObjectCallMethod(g2antt, "TemplatePut", "Dim iteObj,h")
	_ObjectCallMethod(g2antt, "TemplatePut", items)
	_ObjectCallMethod(g2antt, "TemplatePut", h)
	_ObjectCallMethod(g2antt, "ExecuteTemplate", "iteObj.ItemBar(h,``,22) = #1/2/2001#");
	_ObjectCallMethod(g2antt, "ExecuteTemplate", "iteObj.ItemBar(h,``,25) = #1/8/2001#");
	_ObjectCallMethod(g2antt, "ExecuteTemplate", "iteObj.ItemBar(h,``,26) = 32");
	_ObjectCallMethod(g2antt, "ExecuteTemplate", "iteObj.ItemBar(h,``,27) = 90");
	h = _ObjectCallMethod( items , "AddItem", "Item 2");
	_ObjectCallMethod( items , "AddBar", h,"Task","1/1/2001","1/4/2001");
_ObjectCallMethod( g2antt , "EndUpdate");
|
|
761
|
How do I specify a range where the bar can be moved or resized and to highlight the range
OBJECT g2antt,items;

g2antt =  ObjectByName("AN1") ;
_ObjectCallMethod( g2antt , "BeginUpdate");
_ObjectSetProperty( _ObjectGetProperty( g2antt , "Chart") , "FirstVisibleDate", "1/1/2001");
_ObjectCallMethod(g2antt, "ExecuteTemplate", "Chart.ScrollRange(0) = #1/1/2001#");
_ObjectCallMethod(g2antt, "ExecuteTemplate", "Chart.ScrollRange(1) = #1/7/2001#");
_ObjectCallMethod(g2antt, "ExecuteTemplate", "Chart.PaneWidth(0) = 128");
_ObjectCallMethod( _ObjectGetProperty( g2antt , "Columns") , "Add", "Column");
items = _ObjectGetProperty( g2antt , "Items");
	h = _ObjectCallMethod( items , "AddItem", "Item 1");
	_ObjectCallMethod( items , "AddBar", h,"Task","1/1/2001","1/4/2001");
	_ObjectCallMethod(g2antt, "TemplatePut", "Dim iteObj,h")
	_ObjectCallMethod(g2antt, "TemplatePut", items)
	_ObjectCallMethod(g2antt, "TemplatePut", h)
	_ObjectCallMethod(g2antt, "ExecuteTemplate", "iteObj.ItemBar(h,``,22) = #1/2/2001#");
	_ObjectCallMethod(g2antt, "ExecuteTemplate", "iteObj.ItemBar(h,``,25) = #1/8/2001#");
	_ObjectCallMethod(g2antt, "ExecuteTemplate", "iteObj.ItemBar(h,``,26) = 65286");
	_ObjectCallMethod(g2antt, "ExecuteTemplate", "iteObj.ItemBar(h,``,27) = 90");
	h = _ObjectCallMethod( items , "AddItem", "Item 2");
	_ObjectCallMethod( items , "AddBar", h,"Task","1/1/2001","1/4/2001");
_ObjectCallMethod( g2antt , "EndUpdate");
|
|
760
|
How do I specify a range where the bar can be moved or resized
OBJECT g2antt,items;

g2antt =  ObjectByName("AN1") ;
_ObjectCallMethod( g2antt , "BeginUpdate");
_ObjectSetProperty( _ObjectGetProperty( g2antt , "Chart") , "FirstVisibleDate", "1/1/2001");
_ObjectCallMethod(g2antt, "ExecuteTemplate", "Chart.ScrollRange(0) = #1/1/2001#");
_ObjectCallMethod(g2antt, "ExecuteTemplate", "Chart.ScrollRange(1) = #1/7/2001#");
_ObjectCallMethod(g2antt, "ExecuteTemplate", "Chart.PaneWidth(0) = 128");
_ObjectCallMethod( _ObjectGetProperty( g2antt , "Columns") , "Add", "Column");
items = _ObjectGetProperty( g2antt , "Items");
	h = _ObjectCallMethod( items , "AddItem", "Item 1");
	_ObjectCallMethod( items , "AddBar", h,"Task","1/1/2001","1/4/2001");
	_ObjectCallMethod(g2antt, "TemplatePut", "Dim iteObj,h")
	_ObjectCallMethod(g2antt, "TemplatePut", items)
	_ObjectCallMethod(g2antt, "TemplatePut", h)
	_ObjectCallMethod(g2antt, "ExecuteTemplate", "iteObj.ItemBar(h,``,22) = #1/2/2001#");
	_ObjectCallMethod(g2antt, "ExecuteTemplate", "iteObj.ItemBar(h,``,25) = #1/8/2001#");
	h = _ObjectCallMethod( items , "AddItem", "Item 2");
	_ObjectCallMethod( items , "AddBar", h,"Task","1/1/2001","1/4/2001");
_ObjectCallMethod( g2antt , "EndUpdate");
|
|
759
|
How can I change the visual appearance of the milestone bar using EBN
OBJECT appearance,bar,chart,g2antt,items;

g2antt =  ObjectByName("AN1") ;
appearance = _ObjectGetProperty( g2antt , "VisualAppearance");
	_ObjectCallMethod( appearance , "Add", 1,"gBFLBCJwBAEHhEJAEGg4BKMMQAAYAQGKIYBkAKBQAGaAoDDMMILQiMQwjRBMKgBBCLIxiGK4DhiF4aRTHUKAAKQahLEaSZLhEZRQiqA4sS5FQBSBDQFwSByEY6mSaYJ" +
	"AWK4tCyNM7SfQAbxnAgYaLAAYRUjuHZOTZAc4UfAdFL/K4AKrfeZIeAiCRQGiYZyHKaRShjDwXKLIIjbJhkNoJChCNQgBScPgxCx8JypaCaar2fjQM6zWAMdb2Cz7PjD" +
	"H7wPA1WYJRaDYjhcB4LheAqGXBWUYLYb8XS3EKJYhiWA4HjqFjGJpcEzPbRiNx3H6SABlLLaLo7JpGO52FrTHZjXyzLqBVpoOyEbrmcozYzjN41RpWETfQYDcwteqcLp" +
	"rhGVZrm6dp8j4bAnDQP5Uh+OpcH6R4Lg2YJvEIeg6kWEoJB2ZZyG6GoLCSXxtG+IZ1GmfhJjcawNFWfB/h+V5pnUc5VhWeZ4BMX4jlySwtiAJodlEYRaBYFgHHgIA2gG" +
	"ExkFUdxFl6A5hgUbgXgcVRzFiXA3CICARAEgI");
	_ObjectCallMethod( appearance , "Add", 2,"CP:1 -6 0 5 0");
chart = _ObjectGetProperty( g2antt , "Chart");
	_ObjectSetProperty( chart , "FirstVisibleDate", "1/1/2001");
	bar = _ObjectCallMethod( _ObjectGetProperty( chart , "Bars") , "Add", "MilestoneEBN");
		_ObjectSetProperty( bar , "Color", 33554432);
		_ObjectSetProperty( bar , "Height", 14);
_ObjectCallMethod( _ObjectGetProperty( g2antt , "Columns") , "Add", "Tasks");
items = _ObjectGetProperty( g2antt , "Items");
	_ObjectCallMethod( items , "AddBar", _ObjectCallMethod( items , "AddItem", "Milestone"),"Milestone","1/2/2001","1/2/2001 12:00:01 AM");
	_ObjectCallMethod( items , "AddBar", _ObjectCallMethod( items , "AddItem", "Milestone EBN "),"MilestoneEBN","1/2/2001","1/2/2001 12:00:01 AM");
|
|
758
|
How can I change the visual appearance of the summary bar using EBN
OBJECT bar,chart,g2antt,items;

g2antt =  ObjectByName("AN1") ;
_ObjectCallMethod( _ObjectGetProperty( g2antt , "VisualAppearance") , "Add", 1,"gBFLBCJwBAEHhEJAEGg4BGICg6AADACAxRDAMgBQKAAzQFAYZhhBaERiGEaIJhUAIIRZGMQxXAcMQvDSKQJhGDAADEMgyAJCIxjPIgZBoGqPBpASQJUhkMocR7HMygB" +
	"IkSRNA8kMwxdQEaw9ECRIDpGaYWTFDhsABTVQRLL0Tw9ISERqoSSaGgkCYaA7CNJ0PBNJSjJ6LJZGURbKqyCQ1DBbUB3BaUaQ9JaKa7pKa7cpWKIqSxEMrxcLFcT5DSb" +
	"YDxGjLEhmPZBVZQNBxtJbFQHWJCNgzVAdOAAfzQM70GpMQoWJYeVpEObSBD1dABTCBczADYoex7ID+aJuGiYVZdWxJOjfbhkTTIJAaCawABrWxR8iHN5paTnUpzDjwbg" +
	"0kqRRyr+XwjA8Go/HSBp6g6KJTFcGpWmYdg8H6dJTH0EZelueBfBuLwyBMd50nIfR+kmXB4BECQUAaEYMHQHRHCGFRYI2ZAwEIExghQZA2EIQoGGoEhOgGBBYlAeYYHM" +
	"WJcDcGx4HYHoHmICIFjeBohkaDAAC2DAjBYJIIiKSI2CSC5hjQJBsCOCwYiIKoGmKWJkn6DANkiWgzCwYwolAcQkksWJaCuDohlicg2hDQR+EELBInKcJohMJBomILoG" +
	"mISQuESFBOgkOQDg+SoTEyfoXCUSImDyGZhjkaI1hcJgTnoXgACYCYKG2GQkEkVJchKIoZDIbIciYKY+HEP4mlmThSg+aBIlKBYUCUKgGHyG4jEkPoKiAKI6D6EokGkS" +
	"gyECF5jEKVJZD+aYqHKG4nGoCh+iKJ4qEqBokh+KYag6JoqmqKo2iWJpqgKRJHDiT5qk6NYtCsapmjiLprHqdo6i8awan6QovCwOp6kSLQsBsHpGjKbBbBaMYhm0Cgal" +
	"ILBtBsUpTiGUIUAQgIA==");
chart = _ObjectGetProperty( g2antt , "Chart");
	_ObjectSetProperty( chart , "FirstVisibleDate", "1/1/2001");
	bar = _ObjectCallMethod( _ObjectGetProperty( chart , "Bars") , "Copy", "Task","Summary");
		_ObjectSetProperty( bar , "Color", 16777216);
		_ObjectSetProperty( bar , "Height", 16);
_ObjectCallMethod( _ObjectGetProperty( g2antt , "Columns") , "Add", "Tasks");
items = _ObjectGetProperty( g2antt , "Items");
	_ObjectCallMethod( items , "AddBar", _ObjectCallMethod( items , "AddItem", "Task 1"),"Task","1/2/2001","1/4/2001");
	_ObjectCallMethod( items , "AddBar", _ObjectCallMethod( items , "AddItem", "Task 2"),"Summary","1/5/2001","1/7/2001");
|
|
757
|
How can I change the visual appearance of the task bar using EBN
OBJECT bar,chart,g2antt,items;

g2antt =  ObjectByName("AN1") ;
_ObjectCallMethod( _ObjectGetProperty( g2antt , "VisualAppearance") , "Add", 1,"gBFLBCJwBAEHhEJAEGg4BGoCg6AADACAxRDAMgBQKAAzQFAYZhhBaERiGEaIJhUAIIRZGMQxXAcMQvDSKQJhGLhQiSJoJDSBEgSXDIZQ5D6OZYACDJQACJYJTbAYzyP" +
	"JkPRAA6EZCmGAwCglf5HABRb7xNLkbQ8GySKJnWCQJhoD5BSLCNRUTRFFQtGgZBpEWwLCjQNQwWLKFoTJIEPSBDKqYDoKYqTgOOZOThHQz3HakQRdAa/ZpnaKpUo2d47" +
	"XjMWBwGA0EzeAAGaxoShqdoiFaGU7UOJVJBOGwHK6BchoMAKbp6XoVWRaOAWLZWVABM7XLZxbLccyGfZ1XhdV5UbqUMznR7PNrjLKIJpCOJbbyAFwgBaeQABYLhK7iHR" +
	"mi8XYwjMWpjFWOx1GIB5LmgdB4HCEBECSIBpDGHQOicIwokYPImikEIJj6eJIloEgogSc40FGcJEFiYZIG2VIoAURw1g2QxyAQNwNAMPJOgIYI4CoDIBmAeAKBIUpQDU" +
	"KJYDoTpIB4vxgmgdgNgeYZDDoFw7CEJhQn+BohmKfImCWSZRlgYwikYMQ0gwF4DniTA/gwBJYjQYwsgoIg6AyCRQDiIJODAZBImoOguAmMZ4lQLIJjOMI3CYZJpEIT4K" +
	"iKSI6DqD5ZGAAgHC2DAjBYR4SGUGYGE+GIlCmFhRhIB5iFAbwWsiJgMhoCoxngV4ZCcSYOHaGYnHmIg8COJpoCoOISmSWZeHWHgoEkRoAg4EIYB4NogmiSgKg6GRjGoJ" +
	"gFh+ZJKDaBYjmgaQygiBRUHmbhoDsTAyiqIIoioGoOw8aoKhKKoemeOIaAeF5HmqHoqiyKxKgYaN/locgBiuZRojoVIok8cwsjaMBLGqDoAhGIpoEYWYEmAIxUkQLZmg" +
	"iYg2g2I4JiCQwuAqWIOIkEAQICA==");
chart = _ObjectGetProperty( g2antt , "Chart");
	_ObjectSetProperty( chart , "FirstVisibleDate", "1/1/2001");
	bar = _ObjectCallMethod(g2antt, "ExecuteTemplate", "chaObj.Bars.Item(`Task`)");
		_ObjectSetProperty( bar , "Color", 16777216);
		_ObjectSetProperty( bar , "Height", 16);
_ObjectCallMethod( _ObjectGetProperty( g2antt , "Columns") , "Add", "Tasks");
items = _ObjectGetProperty( g2antt , "Items");
	_ObjectCallMethod( items , "AddBar", _ObjectCallMethod( items , "AddItem", "Task 1"),"Task","1/2/2001","1/4/2001");
	_ObjectCallMethod( items , "AddBar", _ObjectCallMethod( items , "AddItem", "Task 2"),"Task","1/5/2001","1/7/2001");
|
|
756
|
How can I change the visual appearance of the task bar using EBN
OBJECT bar,chart,g2antt,items;

g2antt =  ObjectByName("AN1") ;
_ObjectCallMethod( _ObjectGetProperty( g2antt , "VisualAppearance") , "Add", 1,"gBFLBCJwBAEHhEJAEGg4BZsIQAAYAQGKIYBkAKBQAGaAoDDMMILQiMQwjRBMKgBBCLIxiGK4DhiGoZATCMbDBIcSwSGgCJCjeS4ZDKHIXSxFUKTBAcSQTGyBRokaYZR" +
	"i6A4+TRPETTWAEcABHSbQCoKTKAoCHpLQLMYxDKItJSpGYaRgqWCaZpuUIaUzKVbxbK9CSMGiQbIsOJrBqqQozWZHVITLR9VgBNqga7uGR5DoqdovU5dVTVda9Ly5LSs" +
	"MQvfALCqOe45URdNp3RiVBYfI6+cZvfJLWh4NqeAbCMC1UJoYhlUKCBg0TRoVo9AIDX5QWaYXC0AkBA==");
chart = _ObjectGetProperty( g2antt , "Chart");
	_ObjectSetProperty( chart , "FirstVisibleDate", "1/1/2001");
	bar = _ObjectCallMethod(g2antt, "ExecuteTemplate", "chaObj.Bars.Item(`Task`)");
		_ObjectSetProperty( bar , "Color", 16777216);
		_ObjectSetProperty( bar , "Height", 16);
_ObjectCallMethod( _ObjectGetProperty( g2antt , "Columns") , "Add", "Tasks");
items = _ObjectGetProperty( g2antt , "Items");
	_ObjectCallMethod( items , "AddBar", _ObjectCallMethod( items , "AddItem", "Task 1"),"Task","1/2/2001","1/4/2001");
	_ObjectCallMethod( items , "AddBar", _ObjectCallMethod( items , "AddItem", "Task 2"),"Task","1/5/2001","1/7/2001");
|
|
755
|
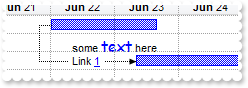
Is there any way to change the units and count of units used in resizing or moving a bar
OBJECT chart,g2antt,items,level;

g2antt =  ObjectByName("AN1") ;
_ObjectCallMethod( g2antt , "BeginUpdate");
_ObjectCallMethod( _ObjectGetProperty( g2antt , "Columns") , "Add", "Task");
chart = _ObjectGetProperty( g2antt , "Chart");
	_ObjectSetProperty( chart , "AllowCreateBar", 0);
	_ObjectSetProperty( chart , "DrawGridLines", -1);
	_ObjectCallMethod(g2antt, "TemplatePut", "Dim chaObj")
	_ObjectCallMethod(g2antt, "TemplatePut", chart)
	_ObjectCallMethod(g2antt, "ExecuteTemplate", "chaObj.PaneWidth(0) = 64");
	_ObjectSetProperty( chart , "FirstVisibleDate", "6/21/2005");
	_ObjectSetProperty( chart , "ResizeUnitScale", 65536);
	_ObjectSetProperty( chart , "ResizeUnitCount", 8);
	_ObjectSetProperty( chart , "UnitWidth", 64);
	level = _ObjectCallMethod(g2antt, "ExecuteTemplate", "chaObj.Level(0)");
		_ObjectSetProperty( level , "Label", "<b><%mmm%></b> <%dd%>");
		_ObjectSetProperty( level , "DrawGridLines", -1);
items = _ObjectGetProperty( g2antt , "Items");
	h = _ObjectCallMethod( items , "AddItem", "Root");
	_ObjectCallMethod( items , "AddBar", h,"Task","6/22/2005","6/23/2005 4:00:00 PM");
	h1 = _ObjectCallMethod( items , "InsertItem", h,"","Task 1");
	_ObjectCallMethod( items , "AddBar", h1,"","6/22/2005","6/24/2005","","some <font Comic Sans MS;12><a>text</a></font> here");
	h1 = _ObjectCallMethod( items , "InsertItem", h,"","Task 2");
	_ObjectCallMethod( items , "AddBar", h1,"Task","6/23/2005 8:00:00 AM","6/28/2005");
	_ObjectCallMethod( items , "AddLink", "Link1",h,"",h1,"");
	_ObjectCallMethod(g2antt, "TemplatePut", "Dim iteObj")
	_ObjectCallMethod(g2antt, "TemplatePut", items)
	_ObjectCallMethod(g2antt, "ExecuteTemplate", "iteObj.Link(`Link1`,6) = 0");
	_ObjectCallMethod(g2antt, "ExecuteTemplate", "iteObj.Link(`Link1`,12) = `<bgcolor=FFFFFF> Link <a>1</a> </bgcolor>`");
	_ObjectCallMethod(g2antt, "TemplatePut", "Dim iteObj,h")
	_ObjectCallMethod(g2antt, "TemplatePut", items)
	_ObjectCallMethod(g2antt, "TemplatePut", h)
	_ObjectCallMethod(g2antt, "ExecuteTemplate", "iteObj.ExpandItem(h) = True");
_ObjectCallMethod( g2antt , "EndUpdate");
|
|
754
|
When trying to resize, move or create a bar, it appears that you can only resize, move or create it in the units that were specified for the level in the timeline. Is there any way to change the units used in resizing or moving a bar
OBJECT chart,g2antt,items;

g2antt =  ObjectByName("AN1") ;
_ObjectCallMethod( g2antt , "BeginUpdate");
_ObjectCallMethod( _ObjectGetProperty( g2antt , "Columns") , "Add", "Task");
chart = _ObjectGetProperty( g2antt , "Chart");
	_ObjectSetProperty( chart , "AllowCreateBar", 0);
	_ObjectCallMethod(g2antt, "TemplatePut", "Dim chaObj")
	_ObjectCallMethod(g2antt, "TemplatePut", chart)
	_ObjectCallMethod(g2antt, "ExecuteTemplate", "chaObj.PaneWidth(0) = 64");
	_ObjectSetProperty( chart , "FirstVisibleDate", "6/21/2005");
	_ObjectSetProperty( chart , "ResizeUnitScale", 65536);
	_ObjectSetProperty( chart , "UnitWidth", 64);
	_ObjectCallMethod(g2antt, "ExecuteTemplate", "chaObj.Level(0).Label = `<b><%mmm%></b> <%dd%>`");
items = _ObjectGetProperty( g2antt , "Items");
	h = _ObjectCallMethod( items , "AddItem", "Root");
	_ObjectCallMethod( items , "AddBar", h,"Task","6/22/2005","6/23/2005 4:00:00 PM");
	h1 = _ObjectCallMethod( items , "InsertItem", h,"","Task 1");
	_ObjectCallMethod( items , "AddBar", h1,"","6/22/2005","6/24/2005","","some <font Comic Sans MS;12><a>text</a></font> here");
	h1 = _ObjectCallMethod( items , "InsertItem", h,"","Task 2");
	_ObjectCallMethod( items , "AddBar", h1,"Task","6/23/2005 8:00:00 AM","6/28/2005");
	_ObjectCallMethod( items , "AddLink", "Link1",h,"",h1,"");
	_ObjectCallMethod(g2antt, "TemplatePut", "Dim iteObj")
	_ObjectCallMethod(g2antt, "TemplatePut", items)
	_ObjectCallMethod(g2antt, "ExecuteTemplate", "iteObj.Link(`Link1`,6) = 0");
	_ObjectCallMethod(g2antt, "ExecuteTemplate", "iteObj.Link(`Link1`,12) = `<bgcolor=FFFFFF> Link <a>1</a> </bgcolor>`");
	_ObjectCallMethod(g2antt, "TemplatePut", "Dim iteObj,h")
	_ObjectCallMethod(g2antt, "TemplatePut", items)
	_ObjectCallMethod(g2antt, "TemplatePut", h)
	_ObjectCallMethod(g2antt, "ExecuteTemplate", "iteObj.ExpandItem(h) = True");
_ObjectCallMethod( g2antt , "EndUpdate");
|
|
753
|
How can I clip the HTML text or caption inside the bar
OBJECT bar,g2antt,items;

g2antt =  ObjectByName("AN1") ;
_ObjectCallMethod( _ObjectGetProperty( g2antt , "Columns") , "Add", "Task");
_ObjectSetProperty( _ObjectGetProperty( g2antt , "Chart") , "FirstVisibleDate", "1/1/2001");
bar = _ObjectCallMethod(g2antt, "ExecuteTemplate", "Chart.Bars.Item(`Task`)");
	_ObjectSetProperty( bar , "Pattern", 32);
	_ObjectSetProperty( bar , "Height", 13);
items = _ObjectGetProperty( g2antt , "Items");
	h = _ObjectCallMethod( items , "AddItem", "Task 1");
	_ObjectCallMethod( items , "AddBar", h,"Task","1/2/2001","1/6/2001","K1","This is a bit of text that get's clipped");
	_ObjectCallMethod(g2antt, "TemplatePut", "Dim iteObj,h")
	_ObjectCallMethod(g2antt, "TemplatePut", items)
	_ObjectCallMethod(g2antt, "TemplatePut", h)
	_ObjectCallMethod(g2antt, "ExecuteTemplate", "iteObj.ItemBar(h,`K1`,4) = 3");
|
|
752
|
How to show the overallocation/workload histogram
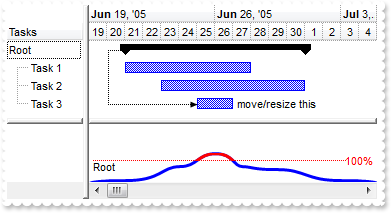
OBJECT bar,chart,g2antt,items;

g2antt =  ObjectByName("AN1") ;
_ObjectCallMethod( g2antt , "BeginUpdate");
_ObjectCallMethod( _ObjectGetProperty( g2antt , "Columns") , "Add", "Tasks");
chart = _ObjectGetProperty( g2antt , "Chart");
	_ObjectSetProperty( chart , "LevelCount", 2);
	_ObjectSetProperty( chart , "NonworkingDays", 0);
	_ObjectCallMethod(g2antt, "TemplatePut", "Dim chaObj")
	_ObjectCallMethod(g2antt, "TemplatePut", chart)
	_ObjectCallMethod(g2antt, "ExecuteTemplate", "chaObj.PaneWidth(0) = 70");
	_ObjectSetProperty( chart , "FirstVisibleDate", "6/20/2005");
	_ObjectSetProperty( chart , "HistogramVisible", -1);
	_ObjectSetProperty( chart , "HistogramHeight", 64);
	bar = _ObjectCallMethod(g2antt, "ExecuteTemplate", "chaObj.Bars.Item(`Task`)");
		_ObjectSetProperty( bar , "HistogramCriticalColor", 255);
		_ObjectSetProperty( bar , "HistogramPattern", 512);
		_ObjectSetProperty( bar , "HistogramType", 1);
items = _ObjectGetProperty( g2antt , "Items");
	h = _ObjectCallMethod( items , "AddItem", "Root");
	_ObjectCallMethod( items , "AddBar", h,"Summary","6/21/2005","7/1/2005");
	h1 = _ObjectCallMethod( items , "InsertItem", h,"","Task 1");
	_ObjectCallMethod( items , "AddBar", h1,"Task","6/21/2005","6/28/2005");
	h1 = _ObjectCallMethod( items , "InsertItem", h,"","Task 2");
	_ObjectCallMethod( items , "AddBar", h1,"Task","6/23/2005","7/1/2005","E");
	_ObjectCallMethod(g2antt, "TemplatePut", "Dim iteObj,h1")
	_ObjectCallMethod(g2antt, "TemplatePut", items)
	_ObjectCallMethod(g2antt, "TemplatePut", h1)
	_ObjectCallMethod(g2antt, "ExecuteTemplate", "iteObj.ItemBar(h1,`E`,21) = 5");
	h1 = _ObjectCallMethod( items , "InsertItem", h,"","Task 3");
	_ObjectCallMethod( items , "AddBar", h1,"Task","6/25/2005","6/27/2005","E");
	_ObjectCallMethod(g2antt, "ExecuteTemplate", "iteObj.ItemBar(h1,`E`,21) = 2");
	_ObjectCallMethod(g2antt, "ExecuteTemplate", "iteObj.ItemBar(h1,`E`,3) = `move/resize this`");
	_ObjectCallMethod(g2antt, "ExecuteTemplate", "iteObj.ItemBar(h1,`E`,4) = 18");
	_ObjectCallMethod(g2antt, "ExecuteTemplate", "iteObj.ItemBar(h1,`E`,6) = `Click the bar and move or resize it. The histogram-graph will be updated.`");
	_ObjectCallMethod( items , "AddLink", "Link1",h,"",h1,"E");
	_ObjectCallMethod(g2antt, "TemplatePut", "Dim iteObj")
	_ObjectCallMethod(g2antt, "TemplatePut", items)
	_ObjectCallMethod(g2antt, "ExecuteTemplate", "iteObj.Link(`Link1`,6) = 0");
	_ObjectCallMethod(g2antt, "TemplatePut", "Dim iteObj,h")
	_ObjectCallMethod(g2antt, "TemplatePut", items)
	_ObjectCallMethod(g2antt, "TemplatePut", h)
	_ObjectCallMethod(g2antt, "ExecuteTemplate", "iteObj.ExpandItem(h) = True");
_ObjectCallMethod( g2antt , "EndUpdate");
|
|
751
|
How to show the overload histogram
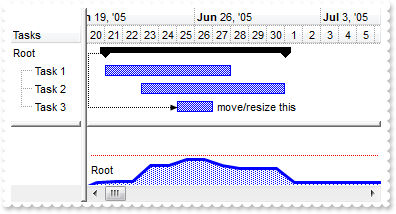
OBJECT bar,chart,g2antt,items;

g2antt =  ObjectByName("AN1") ;
_ObjectCallMethod( g2antt , "BeginUpdate");
_ObjectCallMethod( _ObjectGetProperty( g2antt , "Columns") , "Add", "Tasks");
chart = _ObjectGetProperty( g2antt , "Chart");
	_ObjectSetProperty( chart , "LevelCount", 2);
	_ObjectSetProperty( chart , "NonworkingDays", 0);
	_ObjectCallMethod(g2antt, "TemplatePut", "Dim chaObj")
	_ObjectCallMethod(g2antt, "TemplatePut", chart)
	_ObjectCallMethod(g2antt, "ExecuteTemplate", "chaObj.PaneWidth(0) = 70");
	_ObjectSetProperty( chart , "FirstVisibleDate", "6/20/2005");
	_ObjectSetProperty( chart , "HistogramVisible", -1);
	_ObjectSetProperty( chart , "HistogramHeight", 64);
	bar = _ObjectCallMethod(g2antt, "ExecuteTemplate", "chaObj.Bars.Item(`Task`)");
		_ObjectSetProperty( bar , "HistogramPattern", 258);
		_ObjectSetProperty( bar , "HistogramType", 0);
items = _ObjectGetProperty( g2antt , "Items");
	h = _ObjectCallMethod( items , "AddItem", "Root");
	_ObjectCallMethod( items , "AddBar", h,"Summary","6/21/2005","7/1/2005");
	h1 = _ObjectCallMethod( items , "InsertItem", h,"","Task 1");
	_ObjectCallMethod( items , "AddBar", h1,"Task","6/21/2005","6/28/2005");
	h1 = _ObjectCallMethod( items , "InsertItem", h,"","Task 2");
	_ObjectCallMethod( items , "AddBar", h1,"Task","6/23/2005","7/1/2005","E");
	_ObjectCallMethod(g2antt, "TemplatePut", "Dim iteObj,h1")
	_ObjectCallMethod(g2antt, "TemplatePut", items)
	_ObjectCallMethod(g2antt, "TemplatePut", h1)
	_ObjectCallMethod(g2antt, "ExecuteTemplate", "iteObj.ItemBar(h1,`E`,21) = 5");
	h1 = _ObjectCallMethod( items , "InsertItem", h,"","Task 3");
	_ObjectCallMethod( items , "AddBar", h1,"Task","6/25/2005","6/27/2005","E");
	_ObjectCallMethod(g2antt, "ExecuteTemplate", "iteObj.ItemBar(h1,`E`,21) = 2");
	_ObjectCallMethod(g2antt, "ExecuteTemplate", "iteObj.ItemBar(h1,`E`,3) = `move/resize this`");
	_ObjectCallMethod(g2antt, "ExecuteTemplate", "iteObj.ItemBar(h1,`E`,4) = 18");
	_ObjectCallMethod(g2antt, "ExecuteTemplate", "iteObj.ItemBar(h1,`E`,6) = `Click the bar and move or resize it. The histogram-graph will be updated.`");
	_ObjectCallMethod( items , "AddLink", "Link1",h,"",h1,"E");
	_ObjectCallMethod(g2antt, "TemplatePut", "Dim iteObj")
	_ObjectCallMethod(g2antt, "TemplatePut", items)
	_ObjectCallMethod(g2antt, "ExecuteTemplate", "iteObj.Link(`Link1`,6) = 0");
	_ObjectCallMethod(g2antt, "TemplatePut", "Dim iteObj,h")
	_ObjectCallMethod(g2antt, "TemplatePut", items)
	_ObjectCallMethod(g2antt, "TemplatePut", h)
	_ObjectCallMethod(g2antt, "ExecuteTemplate", "iteObj.ExpandItem(h) = True");
_ObjectCallMethod( g2antt , "EndUpdate");
|
|
750
|
How can I align the text/caption on the scroll bar
OBJECT g2antt;

g2antt =  ObjectByName("AN1") ;
_ObjectCallMethod(g2antt, "ExecuteTemplate", "ScrollPartCaption(1,512) = `left`");
_ObjectCallMethod(g2antt, "ExecuteTemplate", "ScrollPartCaptionAlignment(1,512) = 0");
_ObjectCallMethod(g2antt, "ExecuteTemplate", "ScrollPartCaption(1,128) = `right`");
_ObjectCallMethod(g2antt, "ExecuteTemplate", "ScrollPartCaptionAlignment(1,128) = 2");
_ObjectSetProperty( g2antt , "ColumnAutoResize", 0);
_ObjectCallMethod( _ObjectGetProperty( g2antt , "Columns") , "Add", 1);
_ObjectCallMethod( _ObjectGetProperty( g2antt , "Columns") , "Add", 2);
_ObjectCallMethod( _ObjectGetProperty( g2antt , "Columns") , "Add", 3);
_ObjectCallMethod( _ObjectGetProperty( g2antt , "Columns") , "Add", 4);
|
|
749
|
How do I programmatically control the position of the horizontal scroll bar in the chart area, so I can specify a range of dates to scorll within
OBJECT chart,g2antt,items;

g2antt =  ObjectByName("AN1") ;
_ObjectCallMethod( g2antt , "BeginUpdate");
_ObjectCallMethod( _ObjectGetProperty( g2antt , "Columns") , "Add", "Task");
chart = _ObjectGetProperty( g2antt , "Chart");
	_ObjectSetProperty( chart , "LevelCount", 2);
	_ObjectCallMethod(g2antt, "TemplatePut", "Dim chaObj")
	_ObjectCallMethod(g2antt, "TemplatePut", chart)
	_ObjectCallMethod(g2antt, "ExecuteTemplate", "chaObj.PaneWidth(0) = 56");
	_ObjectCallMethod(g2antt, "ExecuteTemplate", "chaObj.ScrollRange(0) = #1/1/2001#");
	_ObjectCallMethod(g2antt, "ExecuteTemplate", "chaObj.ScrollRange(1) = #1/31/2001#");
	_ObjectSetProperty( chart , "FirstVisibleDate", "1/12/2001");
_ObjectCallMethod(g2antt, "ExecuteTemplate", "ScrollPartCaption(2,512) = Chart.ScrollRange(0)");
_ObjectCallMethod(g2antt, "ExecuteTemplate", "ScrollPartCaptionAlignment(2,512) = 0");
_ObjectCallMethod(g2antt, "ExecuteTemplate", "ScrollPartCaption(2,128) = Chart.ScrollRange(1)");
_ObjectCallMethod(g2antt, "ExecuteTemplate", "ScrollPartCaptionAlignment(2,128) = 2");
items = _ObjectGetProperty( g2antt , "Items");
	h = _ObjectCallMethod( items , "AddItem", "Task 1");
	_ObjectCallMethod( items , "AddBar", h,"Task","1/15/2001","1/18/2001","K1");
	h = _ObjectCallMethod( items , "AddItem", "Task 1");
	_ObjectCallMethod( items , "AddBar", h,"Task","1/5/2001","1/11/2001","K1");
_ObjectCallMethod( g2antt , "EndUpdate");
|
|
748
|
How can I programmatically control the position of the "splitter" between the item list on the left side and the gantt chart on the right
OBJECT g2antt;

g2antt =  ObjectByName("AN1") ;
_ObjectCallMethod(g2antt, "ExecuteTemplate", "Chart.PaneWidth(True) = 196");
|
|
747
|
How can I add a milestone bar and some text in the chart area
OBJECT g2antt,items;

g2antt =  ObjectByName("AN1") ;
_ObjectCallMethod( _ObjectGetProperty( g2antt , "Columns") , "Add", "Task");
_ObjectSetProperty( _ObjectGetProperty( g2antt , "Chart") , "FirstVisibleDate", "1/1/2001");
items = _ObjectGetProperty( g2antt , "Items");
	h = _ObjectCallMethod( items , "AddItem", "Task 1");
	_ObjectCallMethod( items , "AddBar", h,"Milestone","1/2/2001","1/2/2001","","<a1>text</a> outside");
	_ObjectCallMethod(g2antt, "TemplatePut", "Dim iteObj,h")
	_ObjectCallMethod(g2antt, "TemplatePut", items)
	_ObjectCallMethod(g2antt, "TemplatePut", h)
	_ObjectCallMethod(g2antt, "ExecuteTemplate", "iteObj.ItemBar(h,,4) = 18");
|
|
746
|
How can I display or align the bar's caption or text outside of the bar
OBJECT g2antt,items;

g2antt =  ObjectByName("AN1") ;
_ObjectCallMethod( _ObjectGetProperty( g2antt , "Columns") , "Add", "Task");
_ObjectSetProperty( _ObjectGetProperty( g2antt , "Chart") , "FirstVisibleDate", "1/1/2001");
_ObjectSetProperty( g2antt , "DefaultItemHeight", 32);
items = _ObjectGetProperty( g2antt , "Items");
	h = _ObjectCallMethod( items , "AddItem", "Task 1");
	_ObjectCallMethod( items , "AddBar", h,"Task","1/3/2001","1/5/2001","K1");
	_ObjectCallMethod(g2antt, "TemplatePut", "Dim iteObj,h")
	_ObjectCallMethod(g2antt, "TemplatePut", items)
	_ObjectCallMethod(g2antt, "TemplatePut", h)
	_ObjectCallMethod(g2antt, "ExecuteTemplate", "iteObj.ItemBar(h,`K1`,3) = `<b>to do</b>`");
	_ObjectCallMethod(g2antt, "ExecuteTemplate", "iteObj.ItemBar(h,`K1`,4) = 18");
	_ObjectCallMethod(g2antt, "ExecuteTemplate", "iteObj.ItemBar(h,`K1`,5) = 16");
|
|
745
|
How can I display or align the bar's caption or text outside of the bar
OBJECT g2antt,items;

g2antt =  ObjectByName("AN1") ;
_ObjectCallMethod( _ObjectGetProperty( g2antt , "Columns") , "Add", "Task");
_ObjectSetProperty( _ObjectGetProperty( g2antt , "Chart") , "FirstVisibleDate", "1/1/2001");
items = _ObjectGetProperty( g2antt , "Items");
	h = _ObjectCallMethod( items , "AddItem", "Task 1");
	_ObjectCallMethod( items , "AddBar", h,"Task","1/4/2001","1/6/2001","K1");
	_ObjectCallMethod(g2antt, "TemplatePut", "Dim iteObj,h")
	_ObjectCallMethod(g2antt, "TemplatePut", items)
	_ObjectCallMethod(g2antt, "TemplatePut", h)
	_ObjectCallMethod(g2antt, "ExecuteTemplate", "iteObj.ItemBar(h,`K1`,3) = `to do`");
	_ObjectCallMethod(g2antt, "ExecuteTemplate", "iteObj.ItemBar(h,`K1`,4) = 16");
|
|
744
|
How can I display or align the bar's caption or text outside of the bar
OBJECT g2antt,items;

g2antt =  ObjectByName("AN1") ;
_ObjectCallMethod( _ObjectGetProperty( g2antt , "Columns") , "Add", "Task");
_ObjectSetProperty( _ObjectGetProperty( g2antt , "Chart") , "FirstVisibleDate", "1/1/2001");
items = _ObjectGetProperty( g2antt , "Items");
	h = _ObjectCallMethod( items , "AddItem", "Task 1");
	_ObjectCallMethod( items , "AddBar", h,"Task","1/2/2001","1/6/2001","K1");
	_ObjectCallMethod(g2antt, "TemplatePut", "Dim iteObj,h")
	_ObjectCallMethod(g2antt, "TemplatePut", items)
	_ObjectCallMethod(g2antt, "TemplatePut", h)
	_ObjectCallMethod(g2antt, "ExecuteTemplate", "iteObj.ItemBar(h,`K1`,3) = `to do `");
	_ObjectCallMethod(g2antt, "ExecuteTemplate", "iteObj.ItemBar(h,`K1`,4) = 18");
|
|
743
|
Is there any option to keep the working days being constant while user moves the bar
OBJECT g2antt,items;

g2antt =  ObjectByName("AN1") ;
_ObjectCallMethod( g2antt , "BeginUpdate");
_ObjectSetProperty( _ObjectGetProperty( g2antt , "Chart") , "FirstVisibleDate", "1/1/2002");
_ObjectSetProperty( _ObjectCallMethod( _ObjectGetProperty( _ObjectGetProperty( g2antt , "Chart") , "Bars") , "Add", "Task:Split") , "Shortcut", "Task");
_ObjectCallMethod( _ObjectGetProperty( g2antt , "Columns") , "Add", "Task");
items = _ObjectGetProperty( g2antt , "Items");
	h = _ObjectCallMethod( items , "AddItem", "Task 1");
	_ObjectCallMethod( items , "AddBar", h,"Task","1/2/2002","1/4/2002","A");
	_ObjectCallMethod(g2antt, "TemplatePut", "Dim iteObj,h")
	_ObjectCallMethod(g2antt, "TemplatePut", items)
	_ObjectCallMethod(g2antt, "TemplatePut", h)
	_ObjectCallMethod(g2antt, "ExecuteTemplate", "iteObj.ItemBar(h,`A`,20) = True");
_ObjectCallMethod( g2antt , "EndUpdate");
|
|
742
|
Is there any option to count or to specify the working days
OBJECT g2antt,items;

g2antt =  ObjectByName("AN1") ;
_ObjectCallMethod( g2antt , "BeginUpdate");
_ObjectSetProperty( _ObjectGetProperty( g2antt , "Chart") , "FirstVisibleDate", "1/1/2002");
_ObjectCallMethod( _ObjectGetProperty( g2antt , "Columns") , "Add", "Task");
_ObjectSetProperty( _ObjectCallMethod( _ObjectGetProperty( _ObjectGetProperty( g2antt , "Chart") , "Bars") , "Add", "Task:Split") , "Shortcut", "S");
_ObjectCallMethod(g2antt, "ExecuteTemplate", "Chart.PaneWidth(0) = 48");
items = _ObjectGetProperty( g2antt , "Items");
	h = _ObjectCallMethod( items , "AddItem", "Task 1");
	_ObjectCallMethod( items , "AddBar", h,"S","1/3/2002","1/4/2002","A");
	_ObjectCallMethod(g2antt, "TemplatePut", "Dim iteObj,h")
	_ObjectCallMethod(g2antt, "TemplatePut", items)
	_ObjectCallMethod(g2antt, "TemplatePut", h)
	_ObjectCallMethod(g2antt, "ExecuteTemplate", "iteObj.ItemBar(h,`A`,258) = 4");
_ObjectCallMethod( g2antt , "EndUpdate");
|
|
741
|
How do I select the next row/item
OBJECT g2antt,items;

g2antt =  ObjectByName("AN1") ;
_ObjectCallMethod( _ObjectGetProperty( g2antt , "Columns") , "Add", "Column");
items = _ObjectGetProperty( g2antt , "Items");
	_ObjectCallMethod( items , "AddItem", "Item 1");
	_ObjectCallMethod( items , "AddItem", "Item 2");
	_ObjectCallMethod( items , "AddItem", "Item 3");
	_ObjectCallMethod(g2antt, "TemplatePut", "Dim iteObj")
	_ObjectCallMethod(g2antt, "TemplatePut", items)
	_ObjectCallMethod(g2antt, "ExecuteTemplate", "iteObj.SelectItem(NextVisibleItem(FocusItem)) = True");
|
|
740
|
How do I get the selected bars or links
OBJECT g2antt,items;

g2antt =  ObjectByName("AN1") ;
_ObjectCallMethod( g2antt , "BeginUpdate");
_ObjectSetProperty( _ObjectGetProperty( g2antt , "Chart") , "AllowSelectObjects", 1);
_ObjectSetProperty( _ObjectGetProperty( g2antt , "Chart") , "FirstVisibleDate", "1/1/2002");
_ObjectCallMethod( _ObjectGetProperty( g2antt , "Columns") , "Add", "Task");
items = _ObjectGetProperty( g2antt , "Items");
	h = _ObjectCallMethod( items , "AddItem", "Task 1");
	_ObjectCallMethod( items , "AddBar", h,"Task","1/2/2002","1/4/2002","A");
	_ObjectCallMethod( items , "AddBar", h,"Task","1/6/2002","1/10/2002","B");
	_ObjectCallMethod(g2antt, "TemplatePut", "Dim iteObj,h")
	_ObjectCallMethod(g2antt, "TemplatePut", items)
	_ObjectCallMethod(g2antt, "TemplatePut", h)
	_ObjectCallMethod(g2antt, "ExecuteTemplate", "iteObj.ItemBar(h,`A`,257) = True");
_ObjectCallMethod( g2antt , "EndUpdate");
_ObjectCallMethod(g2antt, "TemplatePut", "Dim _ObObj")
_ObjectCallMethod(g2antt, "TemplatePut", _ObjectGetProperty( g2antt , "Items"))
Message( "Bars" );
Message( _ObjectCallMethod(g2antt, "ExecuteTemplate", "_ObObj.SelectedObjects(1)") );
Message( "Links" );
Message( _ObjectCallMethod(g2antt, "ExecuteTemplate", "_ObObj.SelectedObjects(2)") );
|
|
739
|
How can I allow a single link being selected in the chart
OBJECT g2antt,items;

g2antt =  ObjectByName("AN1") ;
_ObjectCallMethod( g2antt , "BeginUpdate");
_ObjectSetProperty( _ObjectGetProperty( g2antt , "Chart") , "AllowSelectObjects", 18);
_ObjectSetProperty( _ObjectGetProperty( g2antt , "Chart") , "FirstVisibleDate", "1/1/2002");
_ObjectCallMethod( _ObjectGetProperty( g2antt , "Columns") , "Add", "Task");
items = _ObjectGetProperty( g2antt , "Items");
	h1 = _ObjectCallMethod( items , "AddItem", "Task 1");
	_ObjectCallMethod( items , "AddBar", h1,"Task","1/2/2002","1/4/2002","A");
	h2 = _ObjectCallMethod( items , "AddItem", "Task 2");
	_ObjectCallMethod( items , "AddBar", h2,"Task","1/6/2002","1/10/2002","B");
	_ObjectCallMethod( items , "AddLink", "AB",h1,"A",h2,"B");
	_ObjectCallMethod( items , "AddLink", "BA",h2,"B",h1,"A");
	_ObjectCallMethod(g2antt, "TemplatePut", "Dim iteObj")
	_ObjectCallMethod(g2antt, "TemplatePut", items)
	_ObjectCallMethod(g2antt, "ExecuteTemplate", "iteObj.Link(`AB`,257) = True");
_ObjectCallMethod( g2antt , "EndUpdate");
|
|
738
|
How can I allow a single bar being selected in the chart
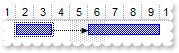
OBJECT g2antt,items;

g2antt =  ObjectByName("AN1") ;
_ObjectCallMethod( g2antt , "BeginUpdate");
_ObjectSetProperty( _ObjectGetProperty( g2antt , "Chart") , "AllowSelectObjects", 17);
_ObjectSetProperty( _ObjectGetProperty( g2antt , "Chart") , "FirstVisibleDate", "1/1/2002");
_ObjectCallMethod( _ObjectGetProperty( g2antt , "Columns") , "Add", "Task");
items = _ObjectGetProperty( g2antt , "Items");
	h = _ObjectCallMethod( items , "AddItem", "Task 1");
	_ObjectCallMethod( items , "AddBar", h,"Task","1/2/2002","1/4/2002","A");
	_ObjectCallMethod( items , "AddBar", h,"Task","1/6/2002","1/10/2002","B");
	_ObjectCallMethod(g2antt, "TemplatePut", "Dim iteObj,h")
	_ObjectCallMethod(g2antt, "TemplatePut", items)
	_ObjectCallMethod(g2antt, "TemplatePut", h)
	_ObjectCallMethod(g2antt, "ExecuteTemplate", "iteObj.ItemBar(h,`A`,257) = True");
	_ObjectCallMethod( items , "AddLink", "AB",h,"A",h,"B");
_ObjectCallMethod( g2antt , "EndUpdate");
|
|
737
|
How do I define the visual appearance of the bar by using your EBN/skin files

OBJECT g2antt,items;

g2antt =  ObjectByName("AN1") ;
_ObjectCallMethod( _ObjectGetProperty( g2antt , "VisualAppearance") , "Add", 1,"c:\exontrol\images\normal.ebn");
_ObjectSetProperty( _ObjectCallMethod( _ObjectGetProperty( _ObjectGetProperty( g2antt , "Chart") , "Bars") , "Copy", "Task","EBN") , "Color", 16777216);
_ObjectSetProperty( _ObjectGetProperty( g2antt , "Chart") , "FirstVisibleDate", "1/1/2001");
_ObjectCallMethod( _ObjectGetProperty( g2antt , "Columns") , "Add", "Column");
items = _ObjectGetProperty( g2antt , "Items");
	_ObjectCallMethod( items , "AddBar", _ObjectCallMethod( items , "AddItem", "Item 1"),"EBN","1/2/2001","1/4/2001");
	_ObjectCallMethod( items , "AddBar", _ObjectCallMethod( items , "AddItem", "Item 2"),"Task","1/2/2001","1/4/2001");
|
|
736
|
Is it possible to have an "empty box" pattern for the bars

OBJECT g2antt,items;

g2antt =  ObjectByName("AN1") ;
_ObjectSetProperty( _ObjectCallMethod( _ObjectGetProperty( _ObjectGetProperty( g2antt , "Chart") , "Bars") , "Copy", "Task","Box") , "Pattern", 32);
_ObjectSetProperty( _ObjectGetProperty( g2antt , "Chart") , "FirstVisibleDate", "1/1/2001");
_ObjectCallMethod( _ObjectGetProperty( g2antt , "Columns") , "Add", "Column");
items = _ObjectGetProperty( g2antt , "Items");
	_ObjectCallMethod( items , "AddBar", _ObjectCallMethod( items , "AddItem", "Item 1"),"Box","1/2/2001","1/4/2001");
	_ObjectCallMethod( items , "AddBar", _ObjectCallMethod( items , "AddItem", "Item 1"),"Task","1/2/2001","1/4/2001");
|
|
735
|
How do I enable resizing ( changing the height ) the items at runtime
OBJECT g2antt,items;

g2antt =  ObjectByName("AN1") ;
_ObjectSetProperty( g2antt , "ItemsAllowSizing", -1);
_ObjectSetProperty( g2antt , "DrawGridLines", 1);
_ObjectSetProperty( g2antt , "ScrollBySingleLine", -1);
_ObjectCallMethod( _ObjectGetProperty( g2antt , "Columns") , "Add", "Column");
_ObjectCallMethod( _ObjectGetProperty( g2antt , "Items") , "AddItem", "Item 1");
items = _ObjectGetProperty( g2antt , "Items");
	_ObjectCallMethod(g2antt, "TemplatePut", "Dim iteObj")
	_ObjectCallMethod(g2antt, "TemplatePut", items)
	_ObjectCallMethod(g2antt, "ExecuteTemplate", "iteObj.ItemHeight(AddItem(`Item 2`)) = 48");
_ObjectCallMethod( _ObjectGetProperty( g2antt , "Items") , "AddItem", "Item 3");
|
|
734
|
How do I enable resizing all the items at runtime
OBJECT g2antt,items;

g2antt =  ObjectByName("AN1") ;
_ObjectSetProperty( g2antt , "ItemsAllowSizing", 1);
_ObjectSetProperty( g2antt , "DrawGridLines", 1);
_ObjectCallMethod( _ObjectGetProperty( g2antt , "Columns") , "Add", "Column");
_ObjectCallMethod( _ObjectGetProperty( g2antt , "Items") , "AddItem", "Item 1");
items = _ObjectGetProperty( g2antt , "Items");
	_ObjectCallMethod(g2antt, "TemplatePut", "Dim iteObj")
	_ObjectCallMethod(g2antt, "TemplatePut", items)
	_ObjectCallMethod(g2antt, "ExecuteTemplate", "iteObj.ItemHeight(AddItem(`Item 2`)) = 48");
_ObjectCallMethod( _ObjectGetProperty( g2antt , "Items") , "AddItem", "Item 3");
|
|
733
|
How can I use your EBN files in the histogram
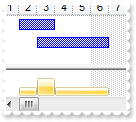
OBJECT bar,chart,g2antt,items;

g2antt =  ObjectByName("AN1") ;
_ObjectCallMethod( _ObjectGetProperty( g2antt , "VisualAppearance") , "Add", 1,"c:\exontrol\images\normal.ebn");
chart = _ObjectGetProperty( g2antt , "Chart");
	_ObjectSetProperty( chart , "FirstVisibleDate", "1/1/2001");
	_ObjectSetProperty( chart , "HistogramVisible", -1);
	_ObjectSetProperty( chart , "HistogramHeight", 32);
	bar = _ObjectCallMethod(g2antt, "ExecuteTemplate", "chaObj.Bars.Item(`Task`)");
		_ObjectSetProperty( bar , "HistogramPattern", 0);
		_ObjectSetProperty( bar , "HistogramColor", 16777216);
_ObjectCallMethod( _ObjectGetProperty( g2antt , "Columns") , "Add", "Column");
items = _ObjectGetProperty( g2antt , "Items");
	_ObjectCallMethod( items , "AddBar", _ObjectCallMethod( items , "AddItem", "Item 1"),"Task","1/2/2001","1/4/2001");
	_ObjectCallMethod( items , "AddBar", _ObjectCallMethod( items , "AddItem", "Item 1"),"Task","1/3/2001","1/7/2001");
|
|
732
|
How can I draw only the shape of the bars in the histogram
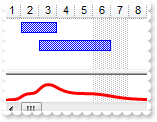
OBJECT bar,chart,g2antt,items;

g2antt =  ObjectByName("AN1") ;
chart = _ObjectGetProperty( g2antt , "Chart");
	_ObjectSetProperty( chart , "FirstVisibleDate", "1/1/2001");
	_ObjectSetProperty( chart , "HistogramVisible", -1);
	_ObjectSetProperty( chart , "HistogramHeight", 32);
	bar = _ObjectCallMethod(g2antt, "ExecuteTemplate", "chaObj.Bars.Item(`Task`)");
		_ObjectSetProperty( bar , "HistogramPattern", 512);
		_ObjectSetProperty( bar , "HistogramColor", 255);
_ObjectCallMethod( _ObjectGetProperty( g2antt , "Columns") , "Add", "Column");
items = _ObjectGetProperty( g2antt , "Items");
	_ObjectCallMethod( items , "AddBar", _ObjectCallMethod( items , "AddItem", "Item 1"),"Task","1/2/2001","1/4/2001");
	_ObjectCallMethod( items , "AddBar", _ObjectCallMethod( items , "AddItem", "Item 1"),"Task","1/3/2001","1/7/2001");
|
|
731
|
How can I draw only the shape of the bars in the histogram
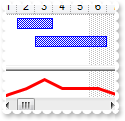
OBJECT bar,chart,g2antt,items;

g2antt =  ObjectByName("AN1") ;
chart = _ObjectGetProperty( g2antt , "Chart");
	_ObjectSetProperty( chart , "FirstVisibleDate", "1/1/2001");
	_ObjectSetProperty( chart , "HistogramVisible", -1);
	_ObjectSetProperty( chart , "HistogramHeight", 32);
	bar = _ObjectCallMethod(g2antt, "ExecuteTemplate", "chaObj.Bars.Item(`Task`)");
		_ObjectSetProperty( bar , "HistogramPattern", 256);
		_ObjectSetProperty( bar , "HistogramColor", 255);
_ObjectCallMethod( _ObjectGetProperty( g2antt , "Columns") , "Add", "Column");
items = _ObjectGetProperty( g2antt , "Items");
	_ObjectCallMethod( items , "AddBar", _ObjectCallMethod( items , "AddItem", "Item 1"),"Task","1/2/2001","1/4/2001");
	_ObjectCallMethod( items , "AddBar", _ObjectCallMethod( items , "AddItem", "Item 1"),"Task","1/3/2001","1/7/2001");
|
|
730
|
How can I change the color of bars in the histogram
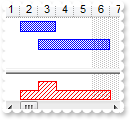
OBJECT bar,chart,g2antt,items;

g2antt =  ObjectByName("AN1") ;
chart = _ObjectGetProperty( g2antt , "Chart");
	_ObjectSetProperty( chart , "FirstVisibleDate", "1/1/2001");
	_ObjectSetProperty( chart , "HistogramVisible", -1);
	_ObjectSetProperty( chart , "HistogramHeight", 32);
	bar = _ObjectCallMethod(g2antt, "ExecuteTemplate", "chaObj.Bars.Item(`Task`)");
		_ObjectSetProperty( bar , "HistogramPattern", 6);
		_ObjectSetProperty( bar , "HistogramColor", 255);
_ObjectCallMethod( _ObjectGetProperty( g2antt , "Columns") , "Add", "Column");
items = _ObjectGetProperty( g2antt , "Items");
	_ObjectCallMethod( items , "AddBar", _ObjectCallMethod( items , "AddItem", "Item 1"),"Task","1/2/2001","1/4/2001");
	_ObjectCallMethod( items , "AddBar", _ObjectCallMethod( items , "AddItem", "Item 1"),"Task","1/3/2001","1/7/2001");
|
|
729
|
How can I show my bars in the histogram
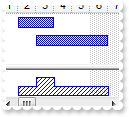
OBJECT chart,g2antt,items;

g2antt =  ObjectByName("AN1") ;
chart = _ObjectGetProperty( g2antt , "Chart");
	_ObjectSetProperty( chart , "FirstVisibleDate", "1/1/2001");
	_ObjectSetProperty( chart , "HistogramVisible", -1);
	_ObjectSetProperty( chart , "HistogramHeight", 32);
	_ObjectCallMethod(g2antt, "TemplatePut", "Dim chaObj")
	_ObjectCallMethod(g2antt, "TemplatePut", chart)
	_ObjectCallMethod(g2antt, "ExecuteTemplate", "chaObj.Bars.Item(`Task`).HistogramPattern = 6");
_ObjectCallMethod( _ObjectGetProperty( g2antt , "Columns") , "Add", "Column");
items = _ObjectGetProperty( g2antt , "Items");
	_ObjectCallMethod( items , "AddBar", _ObjectCallMethod( items , "AddItem", "Item 1"),"Task","1/2/2001","1/4/2001");
	_ObjectCallMethod( items , "AddBar", _ObjectCallMethod( items , "AddItem", "Item 1"),"Task","1/3/2001","1/7/2001");
|
|
728
|
I'm trying to use the percentage display in my gantt's bars. Unfortunately, I don't see any percentage on the gantt chart
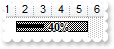
OBJECT bar,g2antt,items;

g2antt =  ObjectByName("AN1") ;
_ObjectCallMethod( _ObjectGetProperty( g2antt , "Columns") , "Add", "Task");
_ObjectSetProperty( _ObjectGetProperty( g2antt , "Chart") , "FirstVisibleDate", "1/1/2001");
bar = _ObjectCallMethod( _ObjectGetProperty( _ObjectGetProperty( g2antt , "Chart") , "Bars") , "Copy", "Task","BarName");
	_ObjectSetProperty( bar , "Color", 255);
	_ObjectSetProperty( bar , "Pattern", 6);
_ObjectSetProperty( _ObjectCallMethod( _ObjectGetProperty( _ObjectGetProperty( g2antt , "Chart") , "Bars") , "Add", "BarName%Progress") , "Shortcut", "Percent");
items = _ObjectGetProperty( g2antt , "Items");
	h = _ObjectCallMethod( items , "AddItem", "Task 1");
	_ObjectCallMethod( items , "AddBar", h,"Percent","1/2/2001","1/6/2001","K1");
	_ObjectCallMethod(g2antt, "TemplatePut", "Dim iteObj,h")
	_ObjectCallMethod(g2antt, "TemplatePut", items)
	_ObjectCallMethod(g2antt, "TemplatePut", h)
	_ObjectCallMethod(g2antt, "ExecuteTemplate", "iteObj.ItemBar(h,`K1`,12) = 0.4");
	_ObjectCallMethod(g2antt, "ExecuteTemplate", "iteObj.ItemBar(h,`K1`,14) = True");
|
|
727
|
How can I show the histogram
OBJECT g2antt,level;

g2antt =  ObjectByName("AN1") ;
_ObjectSetProperty( _ObjectGetProperty( g2antt , "Chart") , "LevelCount", 2);
_ObjectCallMethod(g2antt, "ExecuteTemplate", "Chart.Level(0).Label = 0");
level = _ObjectCallMethod(g2antt, "ExecuteTemplate", "Chart.Level(1)");
	_ObjectSetProperty( level , "Label", "<%mr%>");
	_ObjectSetProperty( level , "Unit", 16);
_ObjectSetProperty( _ObjectGetProperty( g2antt , "Chart") , "HistogramVisible", -1);
|
|
726
|
How I can show Months in Time Unit panel into Roman numerals
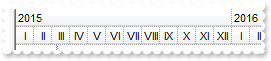
OBJECT g2antt,level;

g2antt =  ObjectByName("AN1") ;
_ObjectSetProperty( _ObjectGetProperty( g2antt , "Chart") , "LevelCount", 2);
_ObjectCallMethod(g2antt, "ExecuteTemplate", "Chart.Level(0).Label = 0");
level = _ObjectCallMethod(g2antt, "ExecuteTemplate", "Chart.Level(1)");
	_ObjectSetProperty( level , "Label", "<%mr%>");
	_ObjectSetProperty( level , "Unit", 16);
|
|
725
|
Can I show a bar with a different vertical position
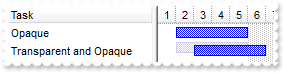
OBJECT g2antt,items;

g2antt =  ObjectByName("AN1") ;
_ObjectCallMethod( _ObjectGetProperty( g2antt , "Columns") , "Add", "Task");
_ObjectSetProperty( _ObjectGetProperty( g2antt , "Chart") , "FirstVisibleDate", "1/1/2001");
items = _ObjectGetProperty( g2antt , "Items");
	h = _ObjectCallMethod( items , "AddItem", "Opaque");
	_ObjectCallMethod( items , "AddBar", h,"Task","1/2/2001","1/6/2001","K1");
	h = _ObjectCallMethod( items , "AddItem", "Transparent and Opaque");
	_ObjectCallMethod( items , "AddBar", h,"Task","1/2/2001","1/6/2001","K1");
	_ObjectCallMethod(g2antt, "TemplatePut", "Dim iteObj,h")
	_ObjectCallMethod(g2antt, "TemplatePut", items)
	_ObjectCallMethod(g2antt, "TemplatePut", h)
	_ObjectCallMethod(g2antt, "ExecuteTemplate", "iteObj.ItemBar(h,`K1`,18) = `-3`");
	_ObjectCallMethod(g2antt, "ExecuteTemplate", "iteObj.ItemBar(h,`K1`,19) = 80");
	_ObjectCallMethod( items , "AddBar", h,"Task","1/3/2001","1/7/2001","K2");
|
|
724
|
How can I show transparent and opaque bars in the same chart
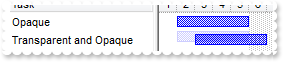
OBJECT g2antt,items;

g2antt =  ObjectByName("AN1") ;
_ObjectCallMethod( _ObjectGetProperty( g2antt , "Columns") , "Add", "Task");
_ObjectSetProperty( _ObjectGetProperty( g2antt , "Chart") , "FirstVisibleDate", "1/1/2001");
items = _ObjectGetProperty( g2antt , "Items");
	h = _ObjectCallMethod( items , "AddItem", "Opaque");
	_ObjectCallMethod( items , "AddBar", h,"Task","1/2/2001","1/6/2001","K1");
	h = _ObjectCallMethod( items , "AddItem", "Transparent and Opaque");
	_ObjectCallMethod( items , "AddBar", h,"Task","1/2/2001","1/6/2001","K1");
	_ObjectCallMethod(g2antt, "TemplatePut", "Dim iteObj,h")
	_ObjectCallMethod(g2antt, "TemplatePut", items)
	_ObjectCallMethod(g2antt, "TemplatePut", h)
	_ObjectCallMethod(g2antt, "ExecuteTemplate", "iteObj.ItemBar(h,`K1`,18) = `-3`");
	_ObjectCallMethod(g2antt, "ExecuteTemplate", "iteObj.ItemBar(h,`K1`,19) = 80");
	_ObjectCallMethod( items , "AddBar", h,"Task","1/3/2001","1/7/2001","K2");
|
|
723
|
How can I draw bars using transparent colors
OBJECT g2antt,items;

g2antt =  ObjectByName("AN1") ;
_ObjectSetProperty( _ObjectGetProperty( g2antt , "Chart") , "ShowTransparentBars", 60);
_ObjectSetProperty( _ObjectGetProperty( g2antt , "Chart") , "FirstVisibleDate", "1/1/2001");
_ObjectSetProperty( _ObjectCallMethod( _ObjectGetProperty( _ObjectGetProperty( g2antt , "Chart") , "Bars") , "Copy", "Task","TaskR") , "Color", 255);
_ObjectCallMethod(g2antt, "ExecuteTemplate", "Chart.PaneWidth(0) = 48");
_ObjectCallMethod( _ObjectGetProperty( g2antt , "Columns") , "Add", "Column");
items = _ObjectGetProperty( g2antt , "Items");
	h = _ObjectCallMethod( items , "AddItem", "Item 1");
	_ObjectCallMethod( items , "AddBar", h,"Task","1/2/2001","1/5/2001","A");
	_ObjectCallMethod( items , "AddBar", h,"TaskR","1/4/2001","1/7/2001","B");
|
|
722
|
How do I select bars and links in the chart area, by dragging
OBJECT g2antt,items;

g2antt =  ObjectByName("AN1") ;
_ObjectCallMethod( g2antt , "BeginUpdate");
_ObjectSetProperty( _ObjectGetProperty( g2antt , "Chart") , "AllowSelectObjects", 3);
_ObjectSetProperty( _ObjectGetProperty( g2antt , "Chart") , "FirstVisibleDate", "1/1/2002");
_ObjectCallMethod( _ObjectGetProperty( g2antt , "Columns") , "Add", "Task");
items = _ObjectGetProperty( g2antt , "Items");
	h1 = _ObjectCallMethod( items , "AddItem", "Task 1");
	_ObjectCallMethod( items , "AddBar", h1,"Task","1/2/2002","1/4/2002","A");
	h2 = _ObjectCallMethod( items , "AddItem", "Task 2");
	_ObjectCallMethod( items , "AddBar", h2,"Task","1/6/2002","1/10/2002","B");
	_ObjectCallMethod( items , "AddLink", "AB",h1,"A",h2,"B");
_ObjectCallMethod( g2antt , "EndUpdate");
|
|
721
|
How do I remove, delete the objects like bars and links selected in the chart area
OBJECT g2antt,items;

g2antt =  ObjectByName("AN1") ;
_ObjectCallMethod( g2antt , "BeginUpdate");
_ObjectSetProperty( _ObjectGetProperty( g2antt , "Chart") , "AllowSelectObjects", 3);
_ObjectSetProperty( _ObjectGetProperty( g2antt , "Chart") , "FirstVisibleDate", "1/1/2002");
_ObjectCallMethod( _ObjectGetProperty( g2antt , "Columns") , "Add", "Task");
items = _ObjectGetProperty( g2antt , "Items");
	h1 = _ObjectCallMethod( items , "AddItem", "Task 1");
	_ObjectCallMethod( items , "AddBar", h1,"Task","1/2/2002","1/4/2002","A");
	_ObjectCallMethod(g2antt, "TemplatePut", "Dim iteObj,h1")
	_ObjectCallMethod(g2antt, "TemplatePut", items)
	_ObjectCallMethod(g2antt, "TemplatePut", h1)
	_ObjectCallMethod(g2antt, "ExecuteTemplate", "iteObj.ItemBar(h1,`A`,257) = True");
	h2 = _ObjectCallMethod( items , "AddItem", "Task 2");
	_ObjectCallMethod( items , "AddBar", h2,"Task","1/6/2002","1/10/2002","B");
	_ObjectCallMethod( items , "AddLink", "AB",h1,"A",h2,"B");
_ObjectCallMethod( g2antt , "EndUpdate");
_ObjectCallMethod( _ObjectGetProperty( g2antt , "Chart") , "RemoveSelection");
|
|
720
|
How do I select links and bars in the chart area
OBJECT g2antt,items;

g2antt =  ObjectByName("AN1") ;
_ObjectCallMethod( g2antt , "BeginUpdate");
_ObjectSetProperty( _ObjectGetProperty( g2antt , "Chart") , "AllowSelectObjects", 3);
_ObjectSetProperty( _ObjectGetProperty( g2antt , "Chart") , "FirstVisibleDate", "1/1/2002");
_ObjectCallMethod( _ObjectGetProperty( g2antt , "Columns") , "Add", "Task");
items = _ObjectGetProperty( g2antt , "Items");
	h1 = _ObjectCallMethod( items , "AddItem", "Task 1");
	_ObjectCallMethod( items , "AddBar", h1,"Task","1/2/2002","1/4/2002","A");
	_ObjectCallMethod(g2antt, "TemplatePut", "Dim iteObj,h1")
	_ObjectCallMethod(g2antt, "TemplatePut", items)
	_ObjectCallMethod(g2antt, "TemplatePut", h1)
	_ObjectCallMethod(g2antt, "ExecuteTemplate", "iteObj.ItemBar(h1,`A`,257) = True");
	h2 = _ObjectCallMethod( items , "AddItem", "Task 2");
	_ObjectCallMethod( items , "AddBar", h2,"Task","1/6/2002","1/10/2002","B");
	_ObjectCallMethod(g2antt, "TemplatePut", "Dim iteObj,h2")
	_ObjectCallMethod(g2antt, "TemplatePut", items)
	_ObjectCallMethod(g2antt, "TemplatePut", h2)
	_ObjectCallMethod(g2antt, "ExecuteTemplate", "iteObj.ItemBar(h2,`B`,257) = True");
	_ObjectCallMethod( items , "AddLink", "AB",h1,"A",h2,"B");
	_ObjectCallMethod(g2antt, "TemplatePut", "Dim iteObj")
	_ObjectCallMethod(g2antt, "TemplatePut", items)
	_ObjectCallMethod(g2antt, "ExecuteTemplate", "iteObj.Link(`AB`,257) = True");
_ObjectCallMethod( g2antt , "EndUpdate");
|
|
719
|
How do I select links in the chart area
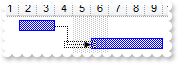
OBJECT g2antt,items;

g2antt =  ObjectByName("AN1") ;
_ObjectCallMethod( g2antt , "BeginUpdate");
_ObjectSetProperty( _ObjectGetProperty( g2antt , "Chart") , "AllowSelectObjects", 2);
_ObjectSetProperty( _ObjectGetProperty( g2antt , "Chart") , "FirstVisibleDate", "1/1/2002");
_ObjectCallMethod( _ObjectGetProperty( g2antt , "Columns") , "Add", "Task");
items = _ObjectGetProperty( g2antt , "Items");
	h1 = _ObjectCallMethod( items , "AddItem", "Task 1");
	_ObjectCallMethod( items , "AddBar", h1,"Task","1/2/2002","1/4/2002","A");
	h2 = _ObjectCallMethod( items , "AddItem", "Task 2");
	_ObjectCallMethod( items , "AddBar", h2,"Task","1/6/2002","1/10/2002","B");
	_ObjectCallMethod( items , "AddLink", "AB",h1,"A",h2,"B");
	_ObjectCallMethod(g2antt, "TemplatePut", "Dim iteObj")
	_ObjectCallMethod(g2antt, "TemplatePut", items)
	_ObjectCallMethod(g2antt, "ExecuteTemplate", "iteObj.Link(`AB`,257) = True");
_ObjectCallMethod( g2antt , "EndUpdate");
|
|
718
|
How do I select bars, or tasks in the chart area
OBJECT g2antt,items;

g2antt =  ObjectByName("AN1") ;
_ObjectCallMethod( g2antt , "BeginUpdate");
_ObjectSetProperty( _ObjectGetProperty( g2antt , "Chart") , "AllowSelectObjects", 1);
_ObjectSetProperty( _ObjectGetProperty( g2antt , "Chart") , "FirstVisibleDate", "1/1/2002");
_ObjectCallMethod( _ObjectGetProperty( g2antt , "Columns") , "Add", "Task");
items = _ObjectGetProperty( g2antt , "Items");
	h = _ObjectCallMethod( items , "AddItem", "Task 1");
	_ObjectCallMethod( items , "AddBar", h,"Task","1/2/2002","1/4/2002","A");
	_ObjectCallMethod( items , "AddBar", h,"Task","1/6/2002","1/10/2002","B");
	_ObjectCallMethod(g2antt, "TemplatePut", "Dim iteObj,h")
	_ObjectCallMethod(g2antt, "TemplatePut", items)
	_ObjectCallMethod(g2antt, "TemplatePut", h)
	_ObjectCallMethod(g2antt, "ExecuteTemplate", "iteObj.ItemBar(h,`A`,257) = True");
	_ObjectCallMethod( items , "AddLink", "AB",h,"A",h,"B");
_ObjectCallMethod( g2antt , "EndUpdate");
|
|
717
|
Can I change the Task bar so it display a Progress or a Percent bar, but it is splitted when the task intersect a non working area
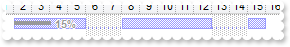
OBJECT chart,g2antt,items;

g2antt =  ObjectByName("AN1") ;
chart = _ObjectGetProperty( g2antt , "Chart");
	_ObjectSetProperty( chart , "ShowTransparentBars", 60);
	_ObjectSetProperty( chart , "FirstVisibleDate", "1/1/2001");
	_ObjectSetProperty( _ObjectCallMethod( _ObjectGetProperty( chart , "Bars") , "Add", "Task%Progress:Split") , "Shortcut", "Task");
	_ObjectCallMethod(g2antt, "TemplatePut", "Dim chaObj")
	_ObjectCallMethod(g2antt, "TemplatePut", chart)
	_ObjectCallMethod(g2antt, "ExecuteTemplate", "chaObj.PaneWidth(0) = 48");
_ObjectCallMethod( _ObjectGetProperty( g2antt , "Columns") , "Add", "Column");
items = _ObjectGetProperty( g2antt , "Items");
	h = _ObjectCallMethod( items , "AddItem", "Item 1");
	_ObjectCallMethod( items , "AddBar", h,"Task","1/2/2001","1/16/2001","K1");
	_ObjectCallMethod(g2antt, "TemplatePut", "Dim iteObj,h")
	_ObjectCallMethod(g2antt, "TemplatePut", items)
	_ObjectCallMethod(g2antt, "TemplatePut", h)
	_ObjectCallMethod(g2antt, "ExecuteTemplate", "iteObj.ItemBar(h,`K1`,12) = 0.15");
	_ObjectCallMethod(g2antt, "ExecuteTemplate", "iteObj.ItemBar(h,`K1`,14) = True");
|
|
716
|
Can I change the Task bar so it display a Progress or a Percent bar

OBJECT chart,g2antt,items;

g2antt =  ObjectByName("AN1") ;
chart = _ObjectGetProperty( g2antt , "Chart");
	_ObjectSetProperty( chart , "FirstVisibleDate", "1/1/2001");
	_ObjectSetProperty( _ObjectCallMethod( _ObjectGetProperty( chart , "Bars") , "Add", "Task%Progress") , "Shortcut", "Task");
_ObjectCallMethod( _ObjectGetProperty( g2antt , "Columns") , "Add", "Column");
items = _ObjectGetProperty( g2antt , "Items");
	h = _ObjectCallMethod( items , "AddItem", "Item 1");
	_ObjectCallMethod( items , "AddBar", h,"Task","1/2/2001","1/5/2001","K1");
	_ObjectCallMethod(g2antt, "TemplatePut", "Dim iteObj,h")
	_ObjectCallMethod(g2antt, "TemplatePut", items)
	_ObjectCallMethod(g2antt, "TemplatePut", h)
	_ObjectCallMethod(g2antt, "ExecuteTemplate", "iteObj.ItemBar(h,`K1`,12) = 0.15");
	_ObjectCallMethod(g2antt, "ExecuteTemplate", "iteObj.ItemBar(h,`K1`,14) = True");
|
|
715
|
How can I remove the filter
OBJECT column,g2antt;

g2antt =  ObjectByName("AN1") ;
column = _ObjectCallMethod( _ObjectGetProperty( g2antt , "Columns") , "Add", "Column");
	_ObjectSetProperty( column , "DisplayFilterButton", -1);
	_ObjectSetProperty( column , "FilterType", 1);
_ObjectCallMethod( g2antt , "ApplyFilter");
_ObjectCallMethod( g2antt , "ClearFilter");
|
|
714
|
I use the ShowEmptyBars property, but I display seconds from 15 to 15, and the bars are not shown correctly. What can I do
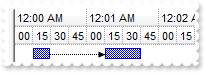
OBJECT chart,g2antt,items,level;

g2antt =  ObjectByName("AN1") ;
_ObjectSetProperty( g2antt , "SelBackColor", 255);
_ObjectCallMethod( g2antt , "BeginUpdate");
chart = _ObjectGetProperty( g2antt , "Chart");
	_ObjectSetProperty( chart , "AllowCreateBar", 1);
	_ObjectSetProperty( chart , "FirstVisibleDate", "1/1/2002");
	_ObjectSetProperty( chart , "LevelCount", 2);
	_ObjectCallMethod(g2antt, "TemplatePut", "Dim chaObj")
	_ObjectCallMethod(g2antt, "TemplatePut", chart)
	_ObjectCallMethod(g2antt, "ExecuteTemplate", "chaObj.Level(0).Label = 1048576");
	level = _ObjectCallMethod(g2antt, "ExecuteTemplate", "chaObj.Level(1)");
		_ObjectSetProperty( level , "Label", "<%ss%>");
		_ObjectSetProperty( level , "Count", 15);
	_ObjectSetProperty( chart , "ShowEmptyBars", 15);
	_ObjectSetProperty( chart , "ShowEmptyBarsUnit", 16777216);
	_ObjectCallMethod(g2antt, "ExecuteTemplate", "chaObj.PaneWidth(0) = 48");
_ObjectCallMethod( _ObjectGetProperty( g2antt , "Columns") , "Add", "Task");
items = _ObjectGetProperty( g2antt , "Items");
	h = _ObjectCallMethod( items , "AddItem", "Task 1");
	_ObjectCallMethod( items , "AddBar", h,"Task","1/1/2002 12:00:15 AM","1/1/2002 12:00:15 AM","A");
	_ObjectCallMethod( items , "AddBar", h,"Task","1/1/2002 12:01:15 AM","1/1/2002 12:01:30 AM","B");
	_ObjectCallMethod( items , "AddLink", "AB",h,"A",h,"B");
_ObjectCallMethod( g2antt , "EndUpdate");
|
|
713
|
I need the bar works like in the MS Project, where task from 1/1/2001 to 1/1/2001 must display 1 day
OBJECT g2antt,items;

g2antt =  ObjectByName("AN1") ;
_ObjectSetProperty( _ObjectGetProperty( g2antt , "Chart") , "FirstVisibleDate", "1/1/2001");
_ObjectSetProperty( _ObjectGetProperty( g2antt , "Chart") , "ShowEmptyBars", 1);
_ObjectCallMethod( _ObjectGetProperty( g2antt , "Columns") , "Add", "Column");
items = _ObjectGetProperty( g2antt , "Items");
	_ObjectCallMethod( items , "AddBar", _ObjectCallMethod( items , "AddItem", "Item 1"),"Task","1/1/2001","1/1/2001");
|
|
712
|
I have a bar that has the start and end date identical. Nothing is displayed. What can I do
OBJECT g2antt,items;

g2antt =  ObjectByName("AN1") ;
_ObjectSetProperty( _ObjectGetProperty( g2antt , "Chart") , "FirstVisibleDate", "1/1/2001");
_ObjectSetProperty( _ObjectGetProperty( g2antt , "Chart") , "ShowEmptyBars", 1);
_ObjectCallMethod( _ObjectGetProperty( g2antt , "Columns") , "Add", "Column");
items = _ObjectGetProperty( g2antt , "Items");
	_ObjectCallMethod( items , "AddBar", _ObjectCallMethod( items , "AddItem", "Item 1"),"Task","1/2/2001","1/2/2001");
|
|
711
|
How can I display seconds and bars for 15 to 15
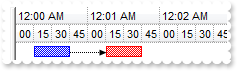
OBJECT g2antt,items,level;

g2antt =  ObjectByName("AN1") ;
_ObjectCallMethod( g2antt , "BeginUpdate");
_ObjectSetProperty( _ObjectGetProperty( g2antt , "Chart") , "AllowCreateBar", 1);
_ObjectSetProperty( _ObjectGetProperty( g2antt , "Chart") , "FirstVisibleDate", "1/1/2002");
_ObjectSetProperty( _ObjectGetProperty( g2antt , "Chart") , "LevelCount", 2);
_ObjectSetProperty( _ObjectGetProperty( g2antt , "Chart") , "ShowEmptyBars", 0);
_ObjectCallMethod(g2antt, "ExecuteTemplate", "Chart.Level(0).Label = 1048576");
level = _ObjectCallMethod(g2antt, "ExecuteTemplate", "Chart.Level(1)");
	_ObjectSetProperty( level , "Label", "<%ss%>");
	_ObjectSetProperty( level , "Count", 15);
_ObjectCallMethod(g2antt, "ExecuteTemplate", "Chart.PaneWidth(0) = 48");
_ObjectSetProperty( _ObjectCallMethod( _ObjectGetProperty( _ObjectGetProperty( g2antt , "Chart") , "Bars") , "Copy", "Task","Task2") , "Color", 255);
_ObjectCallMethod( _ObjectGetProperty( g2antt , "Columns") , "Add", "Task");
items = _ObjectGetProperty( g2antt , "Items");
	h = _ObjectCallMethod( items , "AddItem", "Task 1");
	_ObjectCallMethod( items , "AddBar", h,"Task","1/1/2002 12:00:15 AM","1/1/2002 12:00:45 AM","A");
	_ObjectCallMethod( items , "AddBar", h,"Task2","1/1/2002 12:01:15 AM","1/1/2002 12:01:45 AM","B");
	_ObjectCallMethod( items , "AddLink", "AB",h,"A",h,"B");
_ObjectCallMethod( g2antt , "EndUpdate");
|
|
710
|
How can I vertically display the column's caption, in the header

OBJECT g2antt;

g2antt =  ObjectByName("AN1") ;
_ObjectSetProperty( _ObjectCallMethod( _ObjectGetProperty( g2antt , "Columns") , "Add", "A") , "HeaderVertical", -1);
_ObjectSetProperty( _ObjectCallMethod( _ObjectGetProperty( g2antt , "Columns") , "Add", "B") , "HeaderVertical", -1);
_ObjectSetProperty( _ObjectCallMethod( _ObjectGetProperty( g2antt , "Columns") , "Add", "H") , "HeaderVertical", 0);
|
|
709
|
How can I copy a predefined bar
OBJECT g2antt,items;

g2antt =  ObjectByName("AN1") ;
_ObjectSetProperty( _ObjectCallMethod( _ObjectGetProperty( _ObjectGetProperty( g2antt , "Chart") , "Bars") , "Copy", "Task","T2") , "Color", 255);
_ObjectSetProperty( _ObjectGetProperty( g2antt , "Chart") , "FirstVisibleDate", "1/1/2001");
_ObjectCallMethod( _ObjectGetProperty( g2antt , "Columns") , "Add", "Column");
items = _ObjectGetProperty( g2antt , "Items");
	_ObjectCallMethod( items , "AddBar", _ObjectCallMethod( items , "AddItem", "Item 1"),"T2","1/2/2001","1/4/2001");
|
|
708
|
How can I define my own custom bar, using my icons or pictures

OBJECT bar,bars,g2antt,items;

g2antt =  ObjectByName("AN1") ;
_ObjectCallMethod( g2antt , "Images", "gBJJgBAIDAAGAAEAAQhYAf8Pf4hh0QihCJo2AEZjQAjEZFEaIEaEEaAIAkcbk0olUrlktl0vmExmUzmk1m03nE5nU7nk9n0/oFBoVDolFo1HpFJpVLplNp1PqFRqVTq" +
	"lVq1XrFZrVbrldr1fsFhsVjslls1ntFptVrtltt1vuFxuVzul1u13vF5vV7vl9v1/wGBwWDwmFw2HxGJxWLxmNx0xiFdyOTh8Tf9ZymXx+QytcyNgz8r0OblWjyWds+m" +
	"0ka1Vf1ta1+r1mos2xrG2xeZ0+a0W0qOx3GO4NV3WeyvD2XJ5XL5nN51aiw+lfSj0gkUkAEllHanHI5j/cHg8EZf7w8vl8j4f/qfEZeB09/vjLAB30+kZQAP/P5/H6/y" +
	"NAOAEAwCjMBwFAEDwJBMDwLBYAP2/8Hv8/gAGAD8LQs9w/nhDY/oygIA=");
bars = _ObjectGetProperty( _ObjectGetProperty( g2antt , "Chart") , "Bars");
	_ObjectCallMethod( bars , "AddShapeCorner", 12345,1);
	_ObjectCallMethod( bars , "AddShapeCorner", 22345,2);
	bar = _ObjectCallMethod( bars , "Add", "T2");
		_ObjectSetProperty( bar , "StartShape", 22345);
		_ObjectSetProperty( bar , "EndShape", 12345);
		_ObjectSetProperty( bar , "EndColor", 255);
		_ObjectSetProperty( bar , "Pattern", 2);
		_ObjectSetProperty( bar , "Color", 16711935);
		_ObjectSetProperty( bar , "Shape", 19);
_ObjectSetProperty( _ObjectGetProperty( g2antt , "Chart") , "FirstVisibleDate", "1/1/2001");
_ObjectCallMethod( _ObjectGetProperty( g2antt , "Columns") , "Add", "Column");
items = _ObjectGetProperty( g2antt , "Items");
	_ObjectCallMethod( items , "AddBar", _ObjectCallMethod( items , "AddItem", "Item 1"),"T2","1/2/2001","1/4/2001");
|
|
707
|
How can I access a predefined bar
OBJECT g2antt,items;

g2antt =  ObjectByName("AN1") ;
_ObjectSetProperty( _ObjectGetProperty( g2antt , "Chart") , "FirstVisibleDate", "1/1/2001");
_ObjectCallMethod( _ObjectGetProperty( g2antt , "Columns") , "Add", "Column");
items = _ObjectGetProperty( g2antt , "Items");
	_ObjectCallMethod( items , "AddBar", _ObjectCallMethod( items , "AddItem", "Item 1"),"Task","1/2/2001","1/4/2001");
_ObjectCallMethod(g2antt, "ExecuteTemplate", "Chart.Bars.Item(`Task`).Color = 255");
|
|
706
|
How can I access a predefined bar
OBJECT g2antt,items;

g2antt =  ObjectByName("AN1") ;
_ObjectSetProperty( _ObjectGetProperty( g2antt , "Chart") , "FirstVisibleDate", "1/1/2001");
_ObjectCallMethod( _ObjectGetProperty( g2antt , "Columns") , "Add", "Column");
items = _ObjectGetProperty( g2antt , "Items");
	_ObjectCallMethod( items , "AddBar", _ObjectCallMethod( items , "AddItem", "Item 1"),"Task","1/2/2001","1/4/2001");
_ObjectCallMethod(g2antt, "ExecuteTemplate", "Chart.Bars.Item(`Task`).Color = 255");
|
|
705
|
How can I remove all predefined bars
OBJECT g2antt,items;

g2antt =  ObjectByName("AN1") ;
_ObjectSetProperty( _ObjectGetProperty( g2antt , "Chart") , "FirstVisibleDate", "1/1/2001");
_ObjectCallMethod( _ObjectGetProperty( g2antt , "Columns") , "Add", "Column");
items = _ObjectGetProperty( g2antt , "Items");
	_ObjectCallMethod( items , "AddBar", _ObjectCallMethod( items , "AddItem", "Item 1"),"Task","1/2/2001","1/4/2001");
|
|
704
|
How can I remove a predefined bar
OBJECT g2antt,items;

g2antt =  ObjectByName("AN1") ;
_ObjectSetProperty( _ObjectGetProperty( g2antt , "Chart") , "FirstVisibleDate", "1/1/2001");
_ObjectCallMethod( _ObjectGetProperty( g2antt , "Columns") , "Add", "Column");
items = _ObjectGetProperty( g2antt , "Items");
	_ObjectCallMethod( items , "AddBar", _ObjectCallMethod( items , "AddItem", "Item 1"),"Task","1/2/2001","1/4/2001");
|
|
703
|
How do I get the number of predefined bars
OBJECT g2antt;

g2antt =  ObjectByName("AN1") ;
_ObjectCallMethod( _ObjectGetProperty( g2antt , "Columns") , "Add", _ObjectGetProperty( _ObjectGetProperty( _ObjectGetProperty( g2antt , "Chart") , "Bars") , "Count"));
|
|
702
|
How can I change the shape of the task bar

OBJECT bar,g2antt,items;

g2antt =  ObjectByName("AN1") ;
bar = _ObjectCallMethod( _ObjectGetProperty( _ObjectGetProperty( g2antt , "Chart") , "Bars") , "Copy", "Task","T2");
	_ObjectSetProperty( bar , "EndShape", 2);
	_ObjectSetProperty( bar , "EndColor", 255);
_ObjectSetProperty( _ObjectGetProperty( g2antt , "Chart") , "FirstVisibleDate", "1/1/2001");
_ObjectCallMethod( _ObjectGetProperty( g2antt , "Columns") , "Add", "Column");
items = _ObjectGetProperty( g2antt , "Items");
	_ObjectCallMethod( items , "AddBar", _ObjectCallMethod( items , "AddItem", "Item 1"),"T2","1/2/2001","1/4/2001");
	_ObjectCallMethod( items , "AddBar", _ObjectCallMethod( items , "AddItem", "Item 2"),"Task","1/2/2001","1/4/2001");
|
|
701
|
How can I change the ending shape for all task bars

OBJECT bar,g2antt,items;

g2antt =  ObjectByName("AN1") ;
bar = _ObjectCallMethod(g2antt, "ExecuteTemplate", "Chart.Bars.Item(`Task`)");
	_ObjectSetProperty( bar , "EndShape", 1);
	_ObjectSetProperty( bar , "EndColor", 255);
_ObjectSetProperty( _ObjectGetProperty( g2antt , "Chart") , "FirstVisibleDate", "1/1/2001");
_ObjectCallMethod( _ObjectGetProperty( g2antt , "Columns") , "Add", "Column");
items = _ObjectGetProperty( g2antt , "Items");
	_ObjectCallMethod( items , "AddBar", _ObjectCallMethod( items , "AddItem", "Item 1"),"Task","1/2/2001","1/4/2001");
|